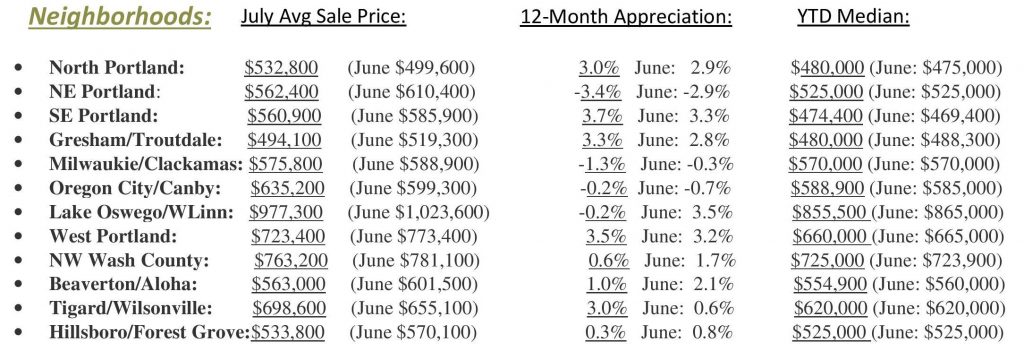
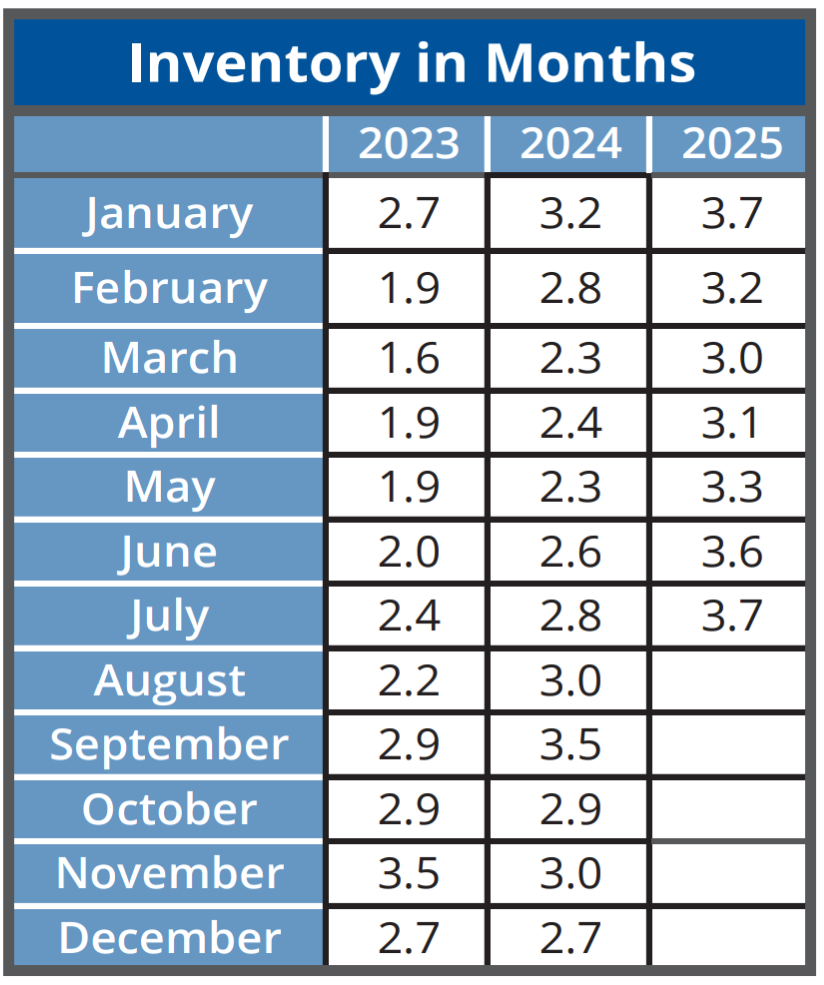
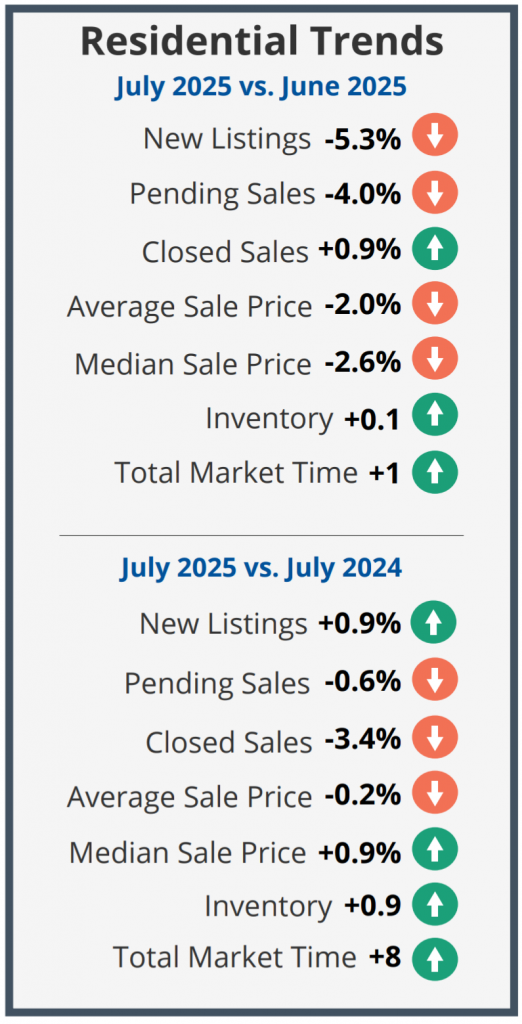
New Listings & Pending Sales are down from the month prior. Inventory has inched up a bit in a continuing trend. July is typically vacation time, so slowing is normal every year. Next month usually shows a seasonal adjustment in increased activity~we’ll see. Prices took quite a dip overall from the month prior, so right now is a great time to Buy if you’ve been thinking about it. Rates are lowering. Check out “Neighborhoods” below to see which ones are going up and which are going down in price: Look at Gresham area, and NE Portland took a pretty big price haircut so there’s an opportunity.
Rates: “We have seen a nice improvement recently with rates moving into the lower 6% range!” Gary Boyer, Certified Mortgage Planner, Vantage Mortgage Brokers
According to the RMLS Market Action Report for the Portland Metro Area July 2025:
- There were 2,931 New Listings in July which increased a slight 0.9% from the 2,905 in July 2024, and decreased 5.3% from the 3,096 in the previous month/June.
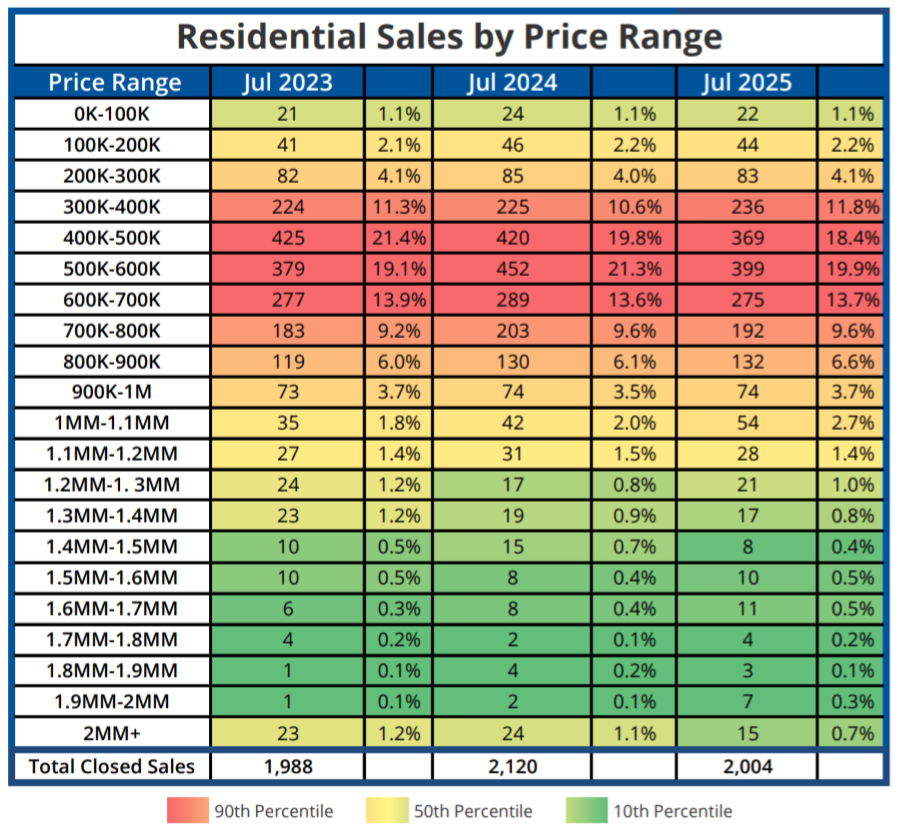
- At 2,005 July 2025’s Closed Sales (Solds) are down 3.4% from July 2024’s 2,075 and up 0.9% from the previous month’s total of 1,988.
- At 2,177 July’s Pending Sales (Accepted Offers) are down 0.6% from July 2024’s 2,191, and up a are decreased 4.0% from the previous month/June’s total of 2,267 Accepted Offers.
- The Average Sale Price for July 2025 of, $621,800 is down $1,100. from last year/July 2024’s $622,900, and down $12,600 from the previous month/June’s $634,400.
- The “Median Sale Price (the price smack dab in the middle of all sales) in July 2025 of $555,000 is up $5,000 from July 2024’s $550,000, & down $15,000 from the previous month’s $570,000.