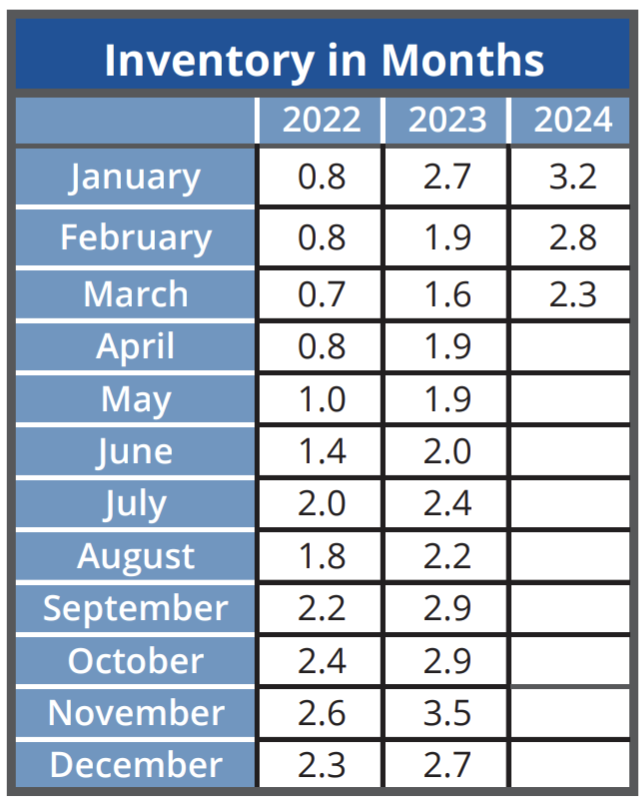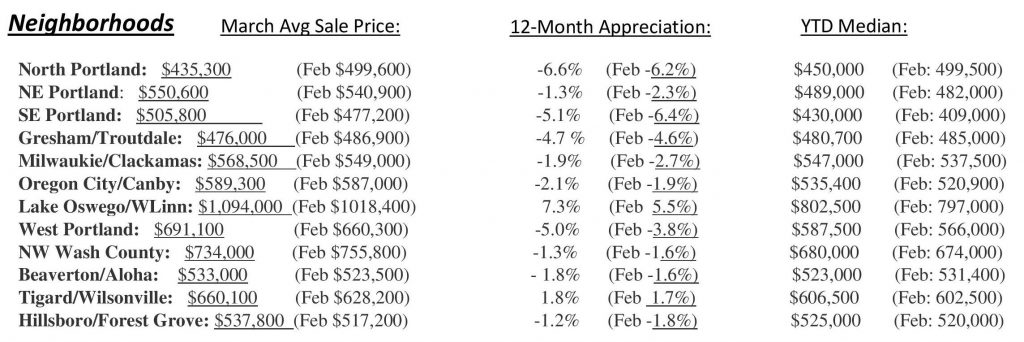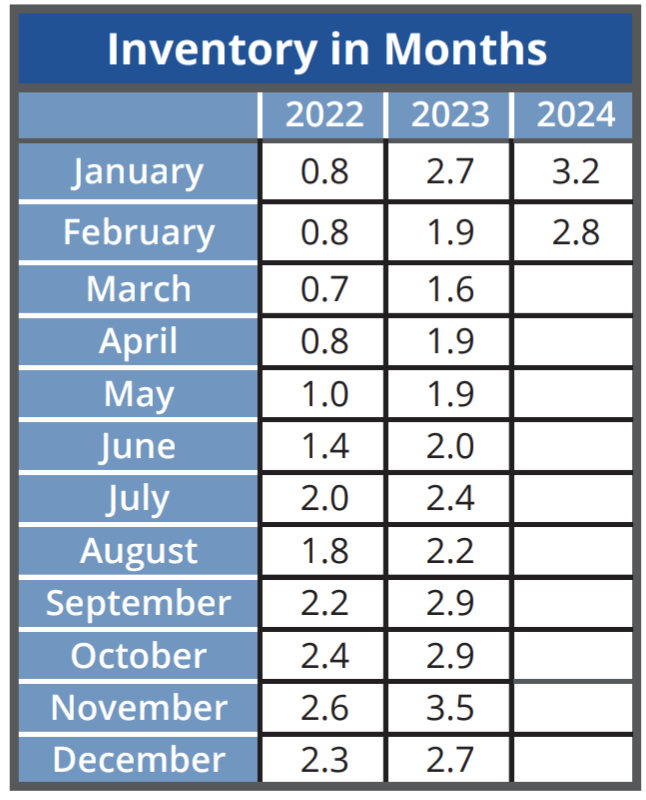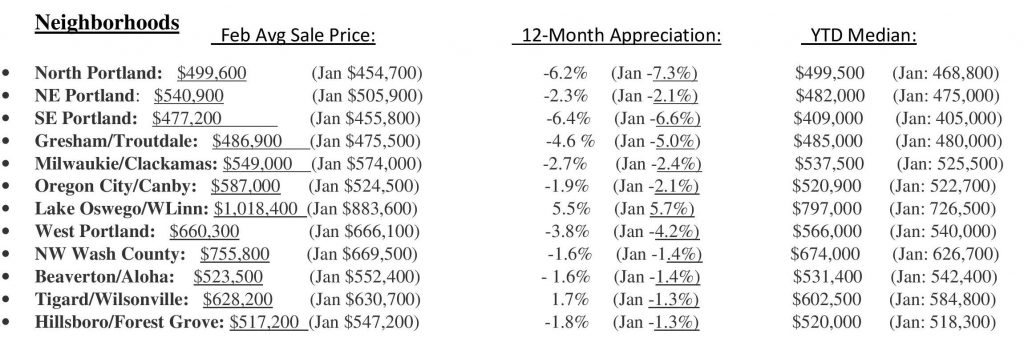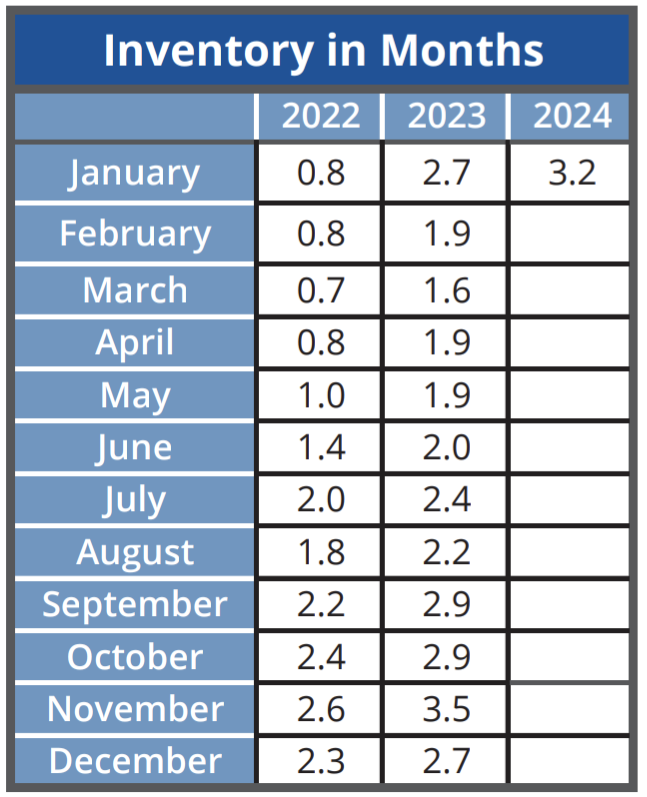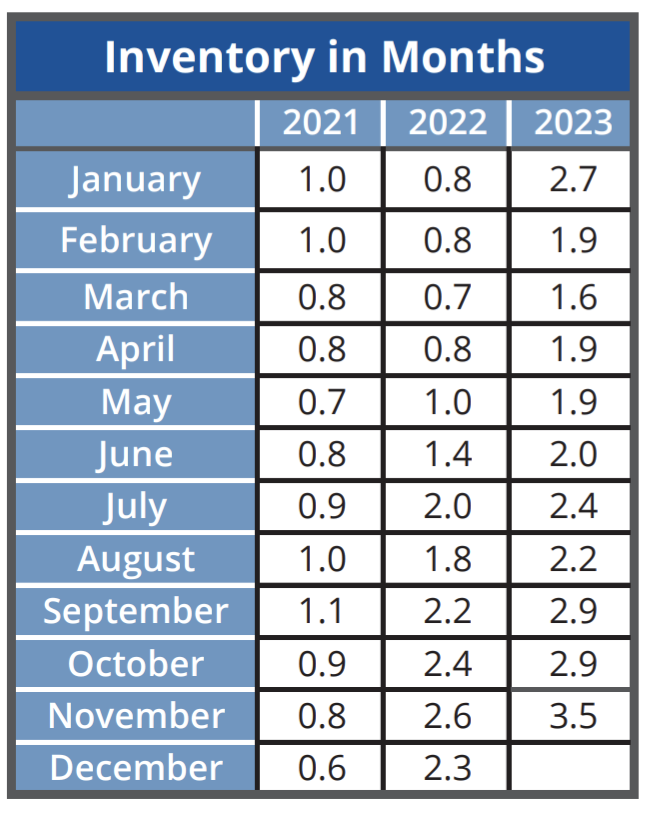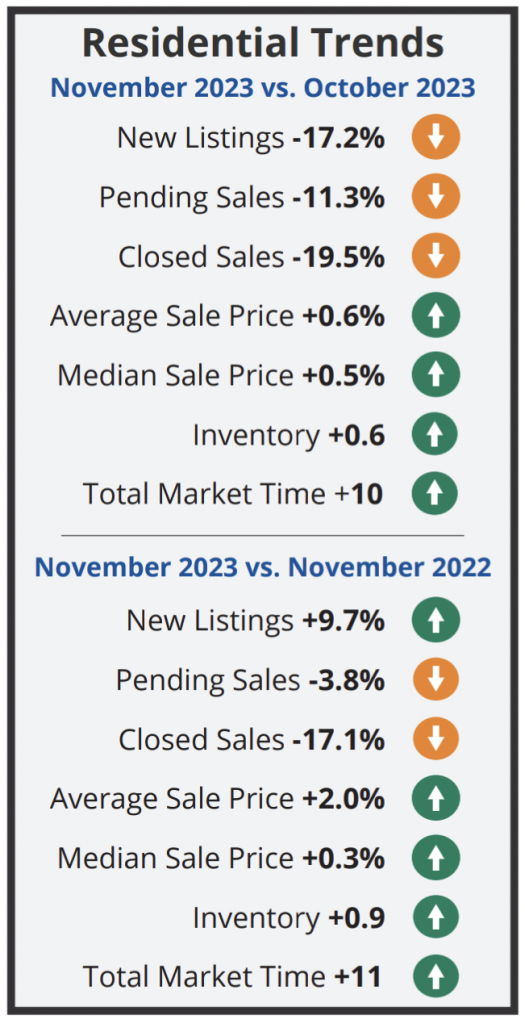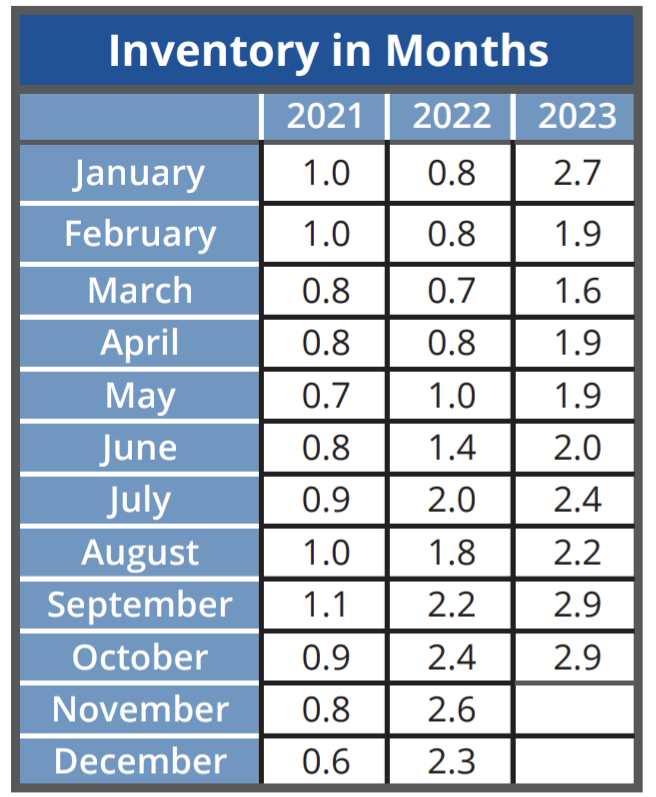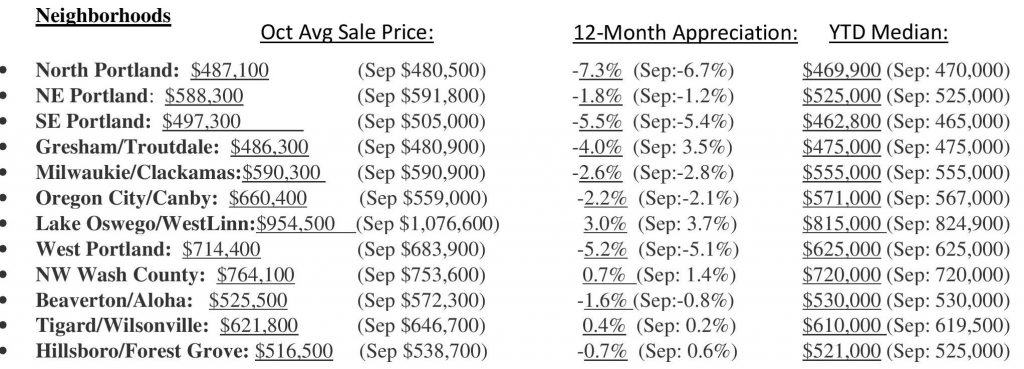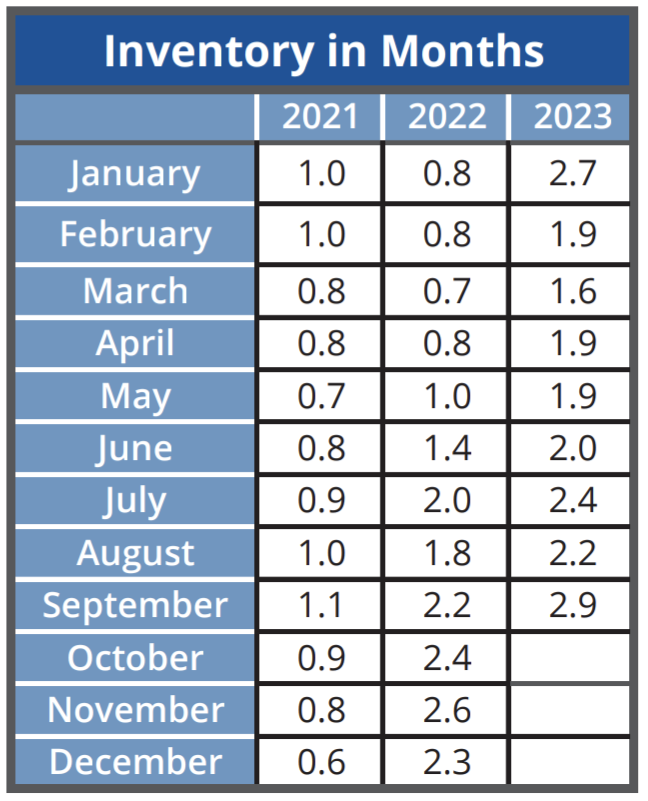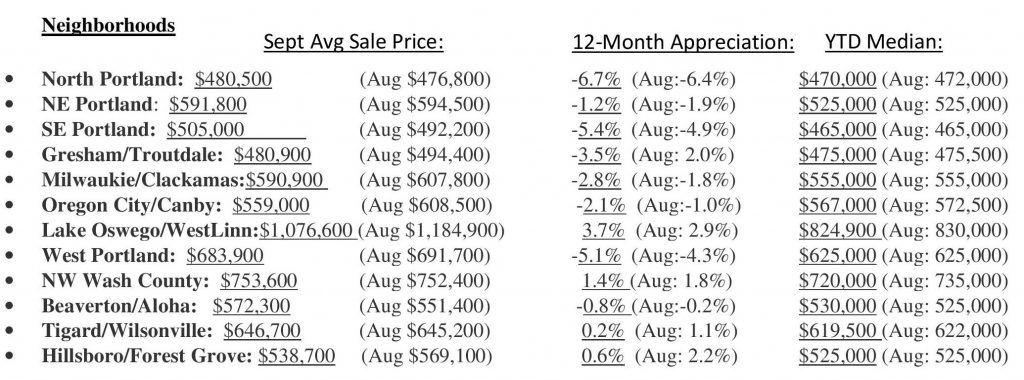
June took a nap on the activity front with decreased New Listings, Pending Listings and Closed Sales. That was not my *personal* experience, Ha! But those are the June overall Portland area numbers. At the same time, more houses are going on the market as we can see from the Inventory rising, and that may be owing to the fact that we see prices rising in most of the metro giving homeowners decent returns on their investments, with West Portland faring better than N, NE & SE Portland. As I mentioned last month, I am anticipating a busier than usual late summer season.

Rates: “Rates are holding steady in the mid 6% range as inflation eases. Markets are looking good!” Gary Boyer, Regional VP, Gold Star Mortgage Financial


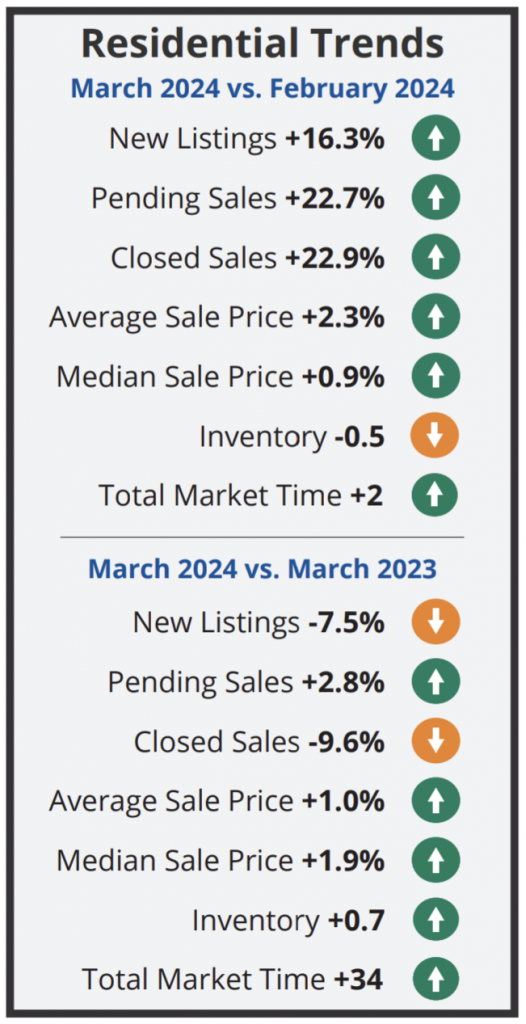
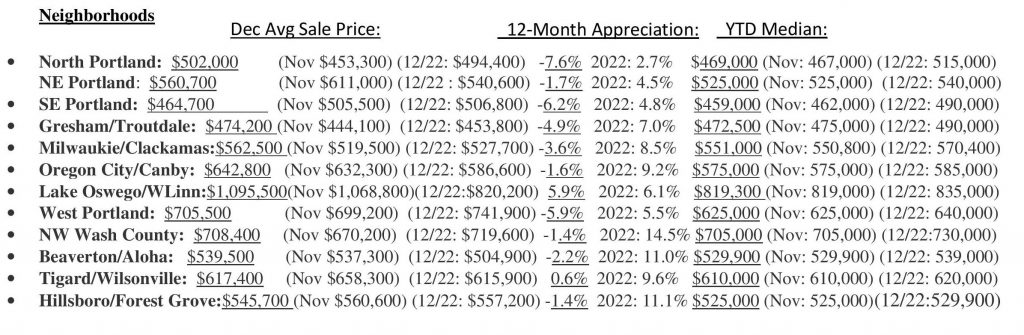
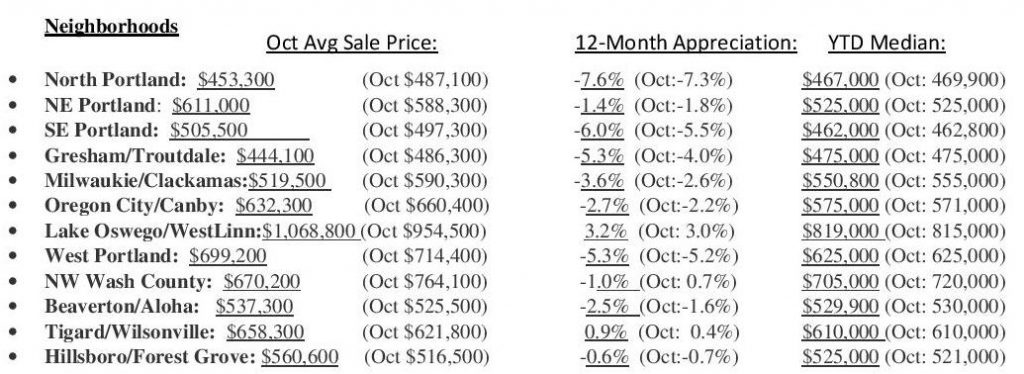
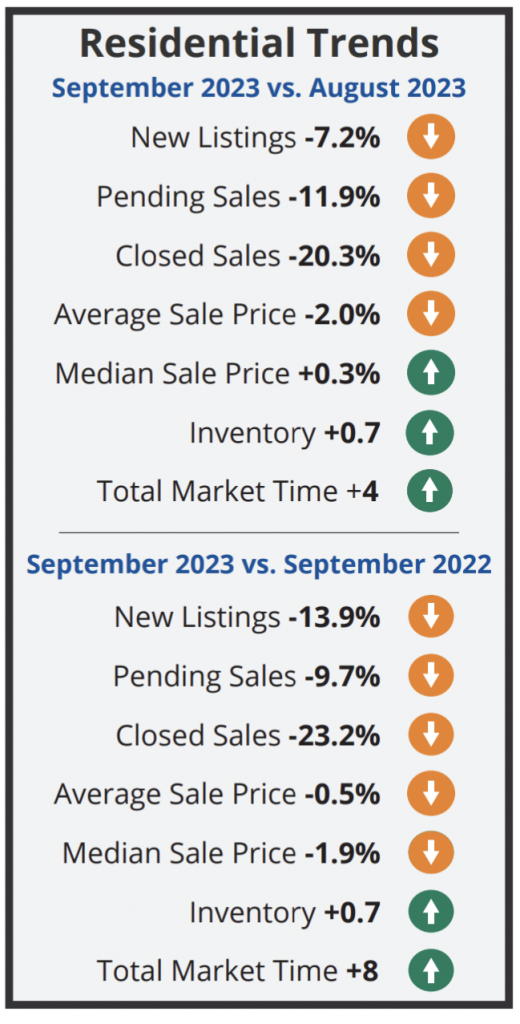
According to the RMLS Market Action Report for the Portland Metro Area June 2024:
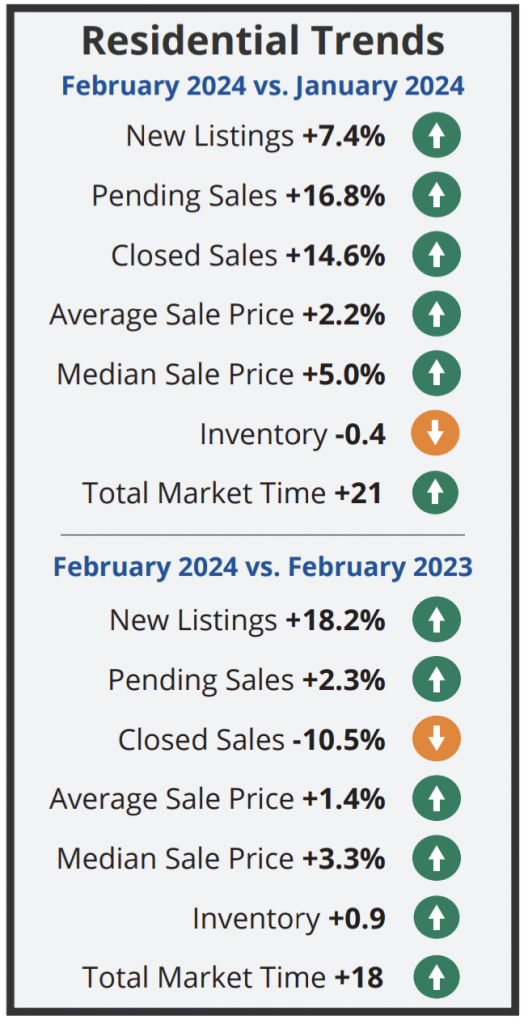
- There were 3,044 New Listings in June which is down 7.7% from 3,298 in June 2023 and also down 13.2% from the 3,508 in the previous month/May.
- At 2,081 June 2024’s Closed Sales (Solds) are down 0.2% from June 2023’s 2,085 and also down 2.8% from the previous month’s total of 2,140.
- At 2,217 June 2024’s Pending Sales (Accepted Offers) decreased 2.4% from June 2023’s 2,272, and also down 6.2% from the previous month/May’s total of 2,363.
- The Average Sale Price for June 2024 of, $636,200 is up$9,400. from last year/June 2023’s $626,800, and up $7,200 from the previous month/May’s $629,000.
- The “Median Sale Price (the price smack dab in the middle of all sales) in June 2024 of $565,000 is up $5,100 from June 2023’s $559,900, & up $6,500 from May’s $558,500