August 2017 Data ~ Portland
Here is your look at the most recent data for the entire Portland area below:
- According to the RMLS Market Action Report for the Portland Metro Area, August, 2017:
- There were 4,048 New Listings in August 2017 which was down 3.7% from August of 2016’s 4,203, and down the same 3.7% from July of 2017’s total of 4,202.
- At 3,034, August Closed Sales were up 1.1% from August 2016’s 3,001, and up 8.6% from the previous month/July 2017’s total of 2,793.
- August Pending Sales (accepted offers), at 3,072 dropped 7.6% from August of 2016’s 3,325, and edged up 1.1% from the previous month/July 2017’s total of 3,040.
- The Average Sale Price in August of $436,400 was up $36,300 from August 2016’s $400,100, and down from June 2017’s $447,400 by $11,000.
August Average Sale Price + Appreciation (last 12 months):
- North Portland: $436,400 9.1% (July $401,100)
- NE Portland: $460,100 11.1% (July $497,000)
- SE Portland: $391,200 8.8% (July $404,100)
- Gresham/Troutdale: $333,300 9.8% (July $327,600)
- Milwaukie/Clackamas: $420,300 12.0% (July $423,100)
- Oregon City/Canby: $394,800 8.1% (July $392,800)
- Lake Oswego/West Linn:$713,800 8.6%(July $741,100)
- West Portland: $567,100 6.7% (July $610,900)
- NW Washington County:$526,500 10.4%(July $536,000)
- Beaverton/Aloha: $376,800 9.9% (July $380,900)
- Tigard/Wilsonville: $439,300 5.9% (July $440,700)
- Hillsboro/Forest Grove: $382,800 13.0% (June $385,100)
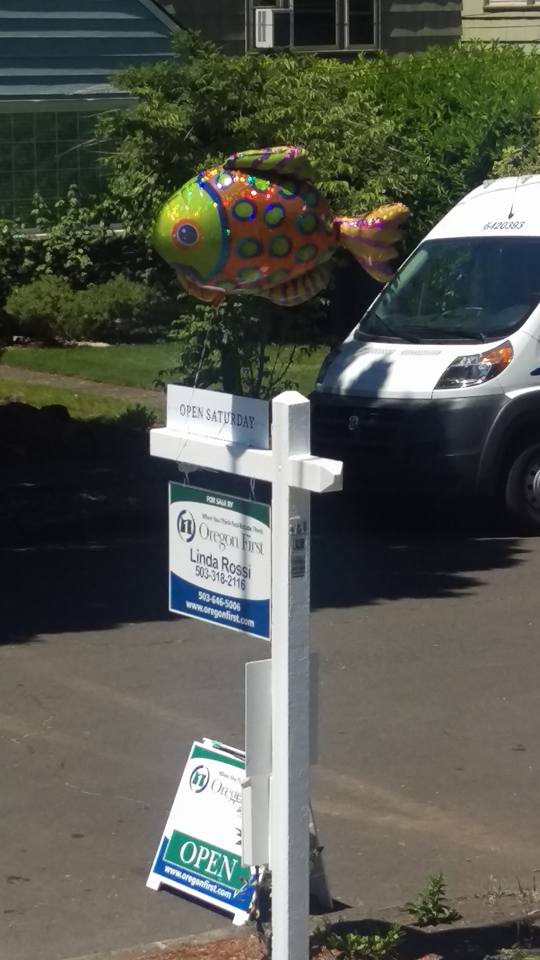
Win/Win ~
6 Days – $25,000 Over Asking. Happy Buyers and Sellers!

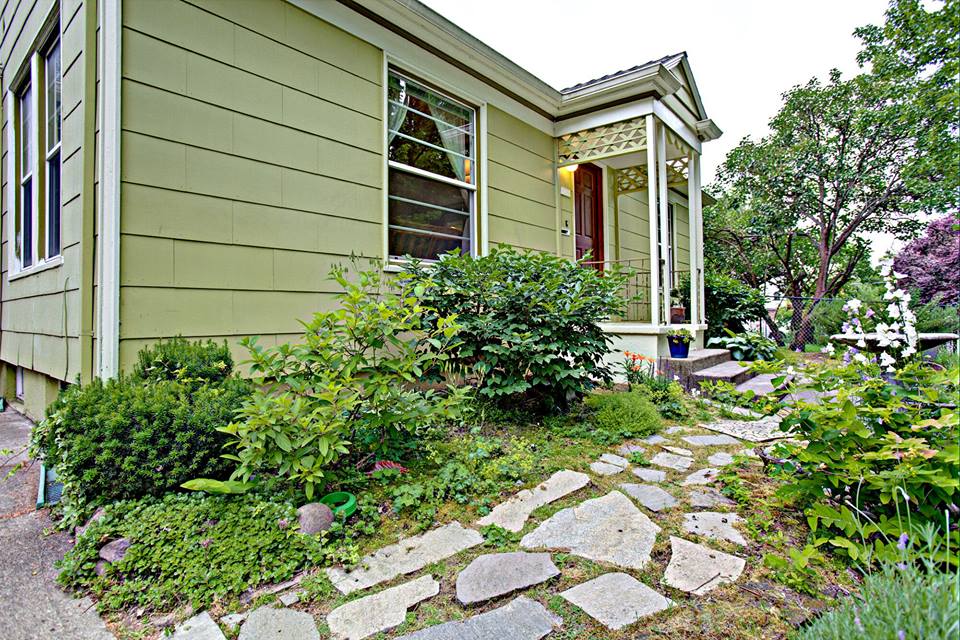
Kennedy School Beauty
Someone is enjoying “The Life” now! I Loved selling this one…

Its How I Do
5 Days. $26,000 Over Asking.
This Homeowner is on to new adventures~
See If You Can Buy Instead…
Check it out: Hourly Income Needed to Rent Across The US
Portland Roses
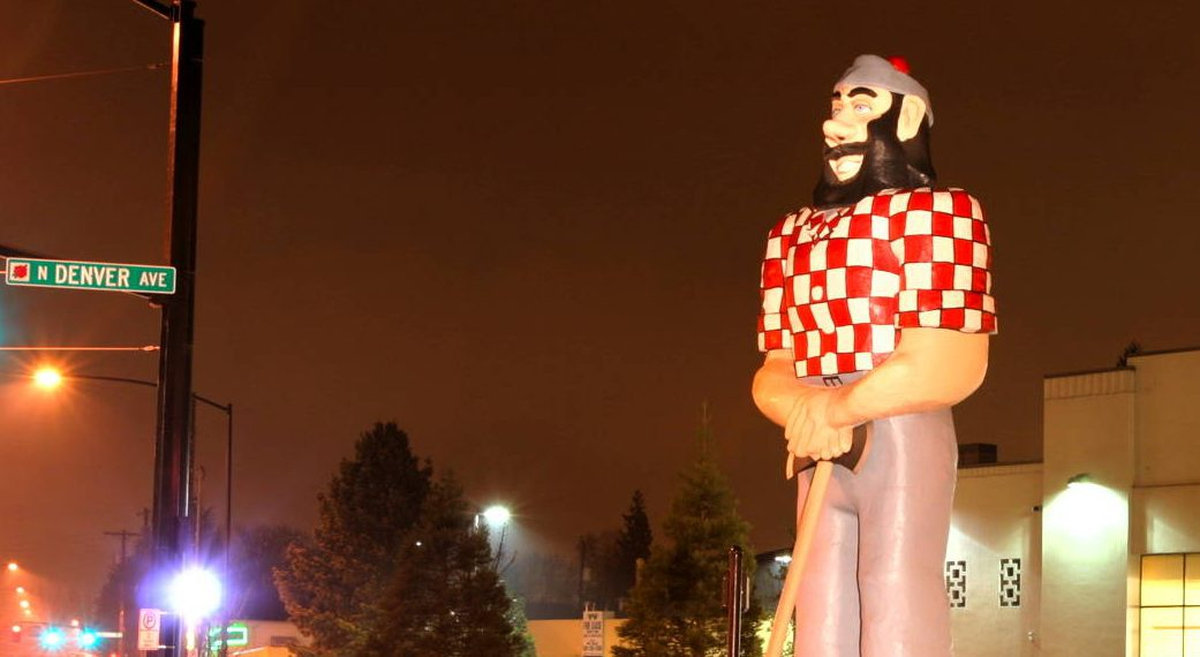
St Johns ~
Meow

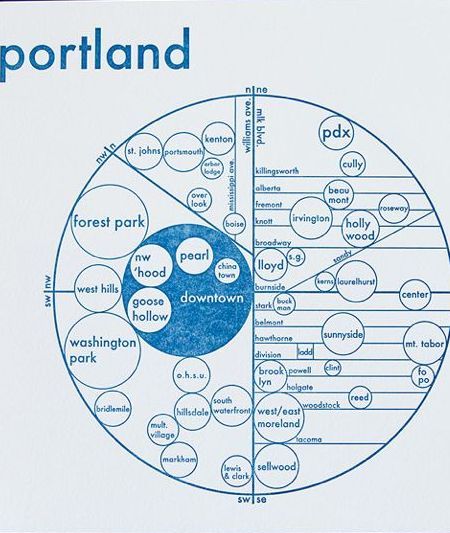
Portland in a Nutshell: