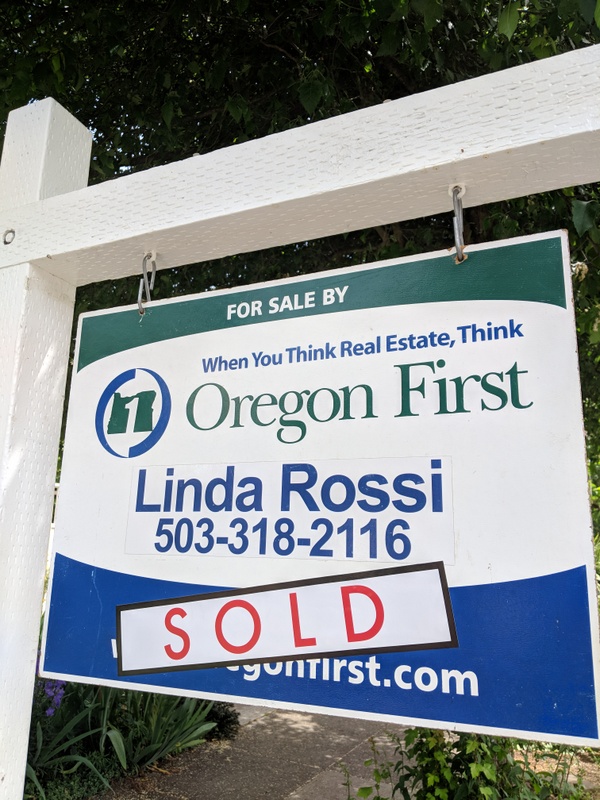
The Portland Neighborhood Specialist
Linda Rossi - August 15, 2018
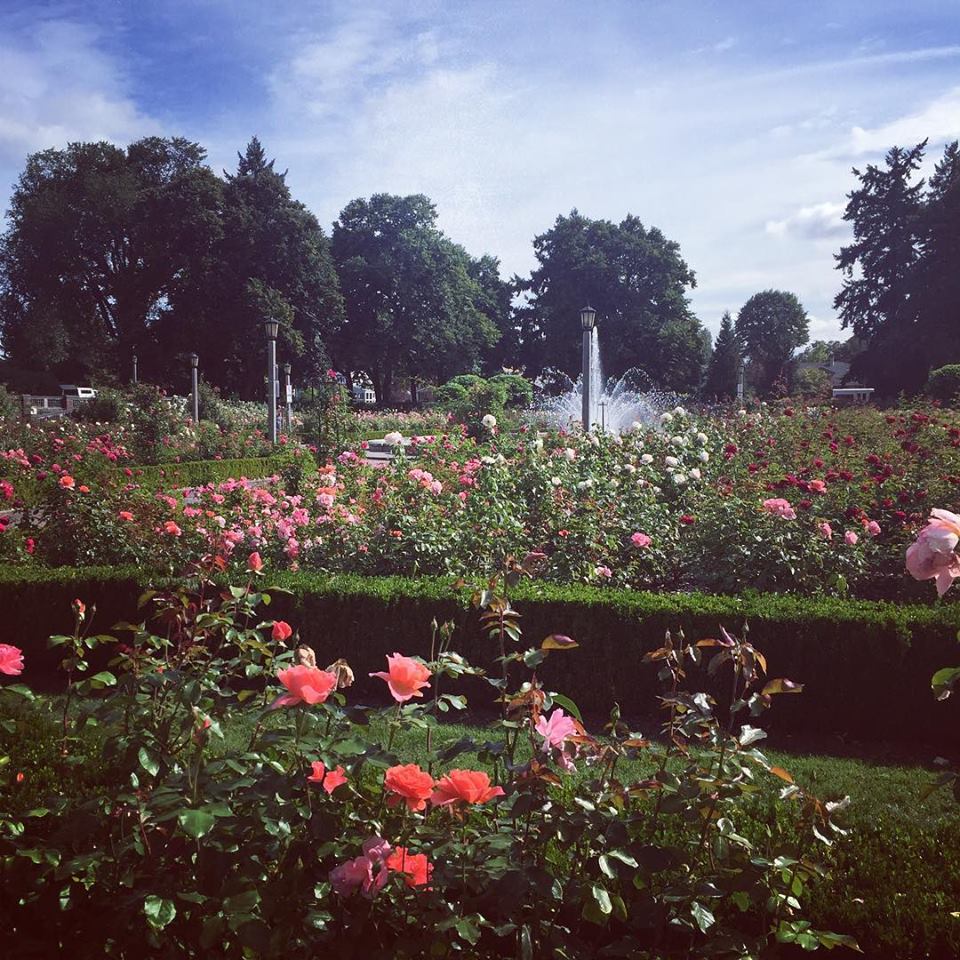
NE & SE Portland are my backyard & where family & some of my favorite people reside. I also specialize in Lake Oswego & SW Portland from my 10 years of living and working there (check out www.PropertyBlotter.com ). I've been comfortably ensconced in the Alberta Arts neighborhood of NE Portland for some time now, and lived for many years in the Hollywood District before that. Alameda, Sabin and Irving Park are on my daily routes. Piedmont is where I enjoy the roses, and Mississippi is where I love to stroll & pick up odds & ends at the ReBuilding Center. NW Portland is where I practice yoga and meet friends for movies at my favorite theater...Cinema 21 (they have real butter!). I also love helping clients all over North Portland and in St Johns where my husband has an all-natural dog & cat food & supply company...Tre Bone! Let me put my deep knowledge of Portland neighborhoods and 14 years of experience to work for you!