April 14, 2026
Overview/Fluctuations ~ March 2026 Market Data:
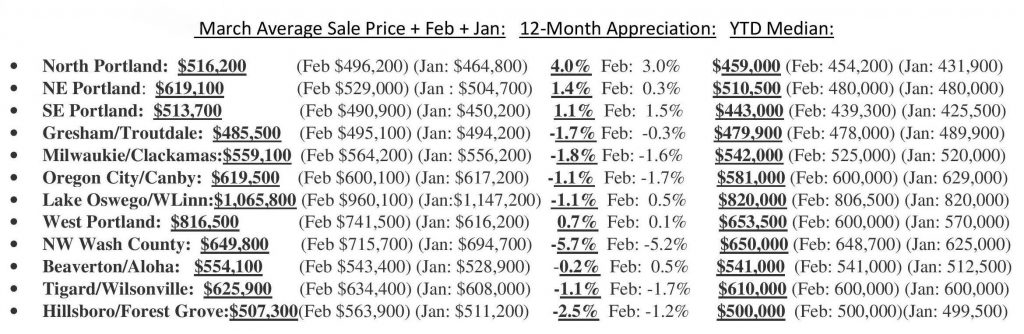
***Please see the Neighborhoods Breakdown at the bottom to compare your own area or area of choice where I offer a 3-month trajectory on Pricing~
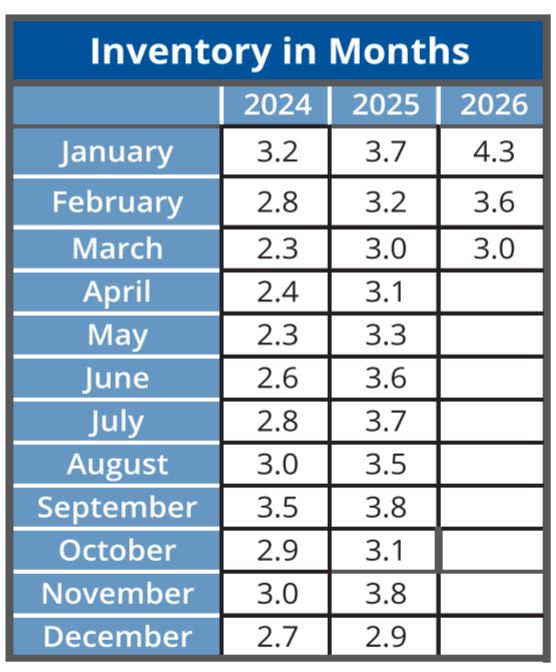
Time on Market decreased from 91 in February to 79 days in March. Activity continued to increase in March with increases in Listings, Pending & Closed Sales. Overall prices rose for the metro even as different parts of town rose and others fell from February (such as Gresham, Milwaukie, NW Washington County & Hillsboro). Interestingly enough, when comparing the first 3 months of 2026 to the same in 2025, Average Sale Price decreased by 1.4% and Median Price decreased by 2.8%. Inventory is at 3.0% right now and Buyers are out in force.
Rates: “Inflation concerns stemming from the Iran conflict are pushing rates back over 6%.” Gary Boyer, Certified Mortgage Planner, Premier Mortgage Resources
- There were 2,738 New Listings in March which increased 2.7% from the 2,667 in March 2025, & increased 21.2% from the 2,260 in the previous month/Feb.
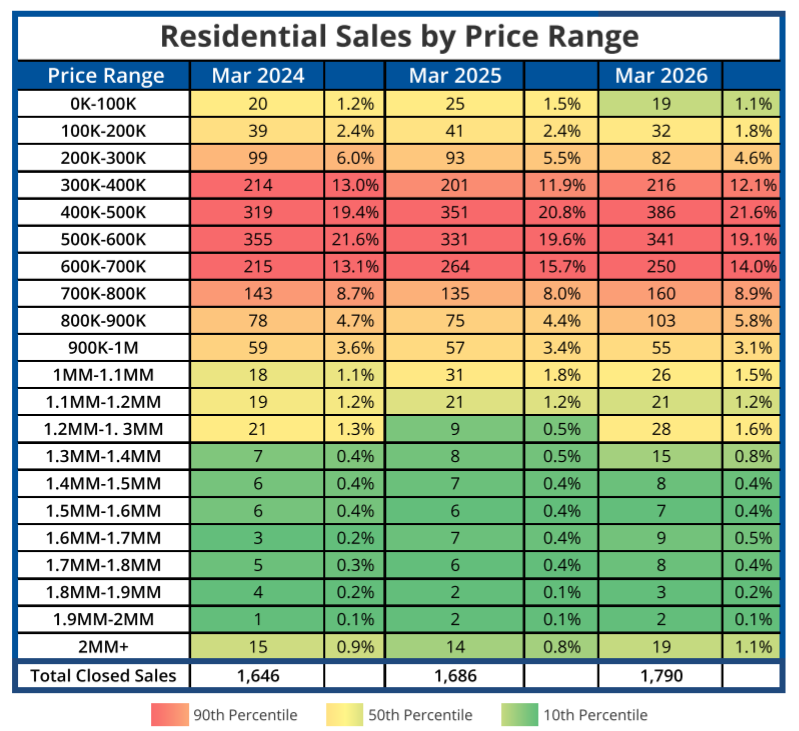
- At 1,790 March 2026’s Closed Sales (Solds) are up 11.0% from March 2025’s 1,613, and increased a substantial 27.4% from the previous month’s total of 1,405.
- At 2,319 March’s Pending Sales (Accepted Offers) are up 5.5% from March 2025’s 2,199, and up a whopping 27.3% from the previous month/February’s total of 1,821 Accepted Offers.
- The Average Sale Price for March 2026 of, $614,200 is up $16,800. from last year/March 2025’s $597,400, and up $23,600 from the previous month/Feb’s $590,600.
- The “Median Sale Price” (the price smack dab in the middle of all sales) in March 2026 of $543,800 is up $1,800 from March 2025’s $542,000, & up $18,800 from the previous month’s $525,000.
Neighborhoods: