Linda Rossi – March 23, 2019

My friend really knows how to build ’em~

Getting You Where You Want To Go
Linda Rossi – March 23, 2019
My friend really knows how to build ’em~
Linda Rossi – March 18, 2019
Overview/Fluctuations Here is your look at the most recent data for the entire Portland area, February 2019.
According to the RMLS Market Action Report for the Portland Metro Area:
Neighborhoods:
February’s Average Sale Price + 12-month Appreciation (and YTD Median):
Linda Rossi – March 7, 2019

Linda Rossi – February 28, 2019

Great Food to Come!!! Stay tuned~
Linda Rossi – February 15, 2019
Overview/Fluctuations
Here is your look at the most recent data for the entire Portland area, January 2019.
According to the RMLS Market Action Report for the Portland Metro Area:
Neighborhoods
January’s Average Sale Price + 12-month Appreciation (+Dec Avg + YTD Median):
Linda Rossi – January 18, 2019
~ Ultra Current Portland Real Estate News ~
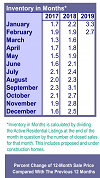
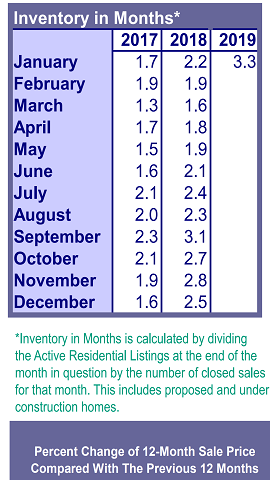
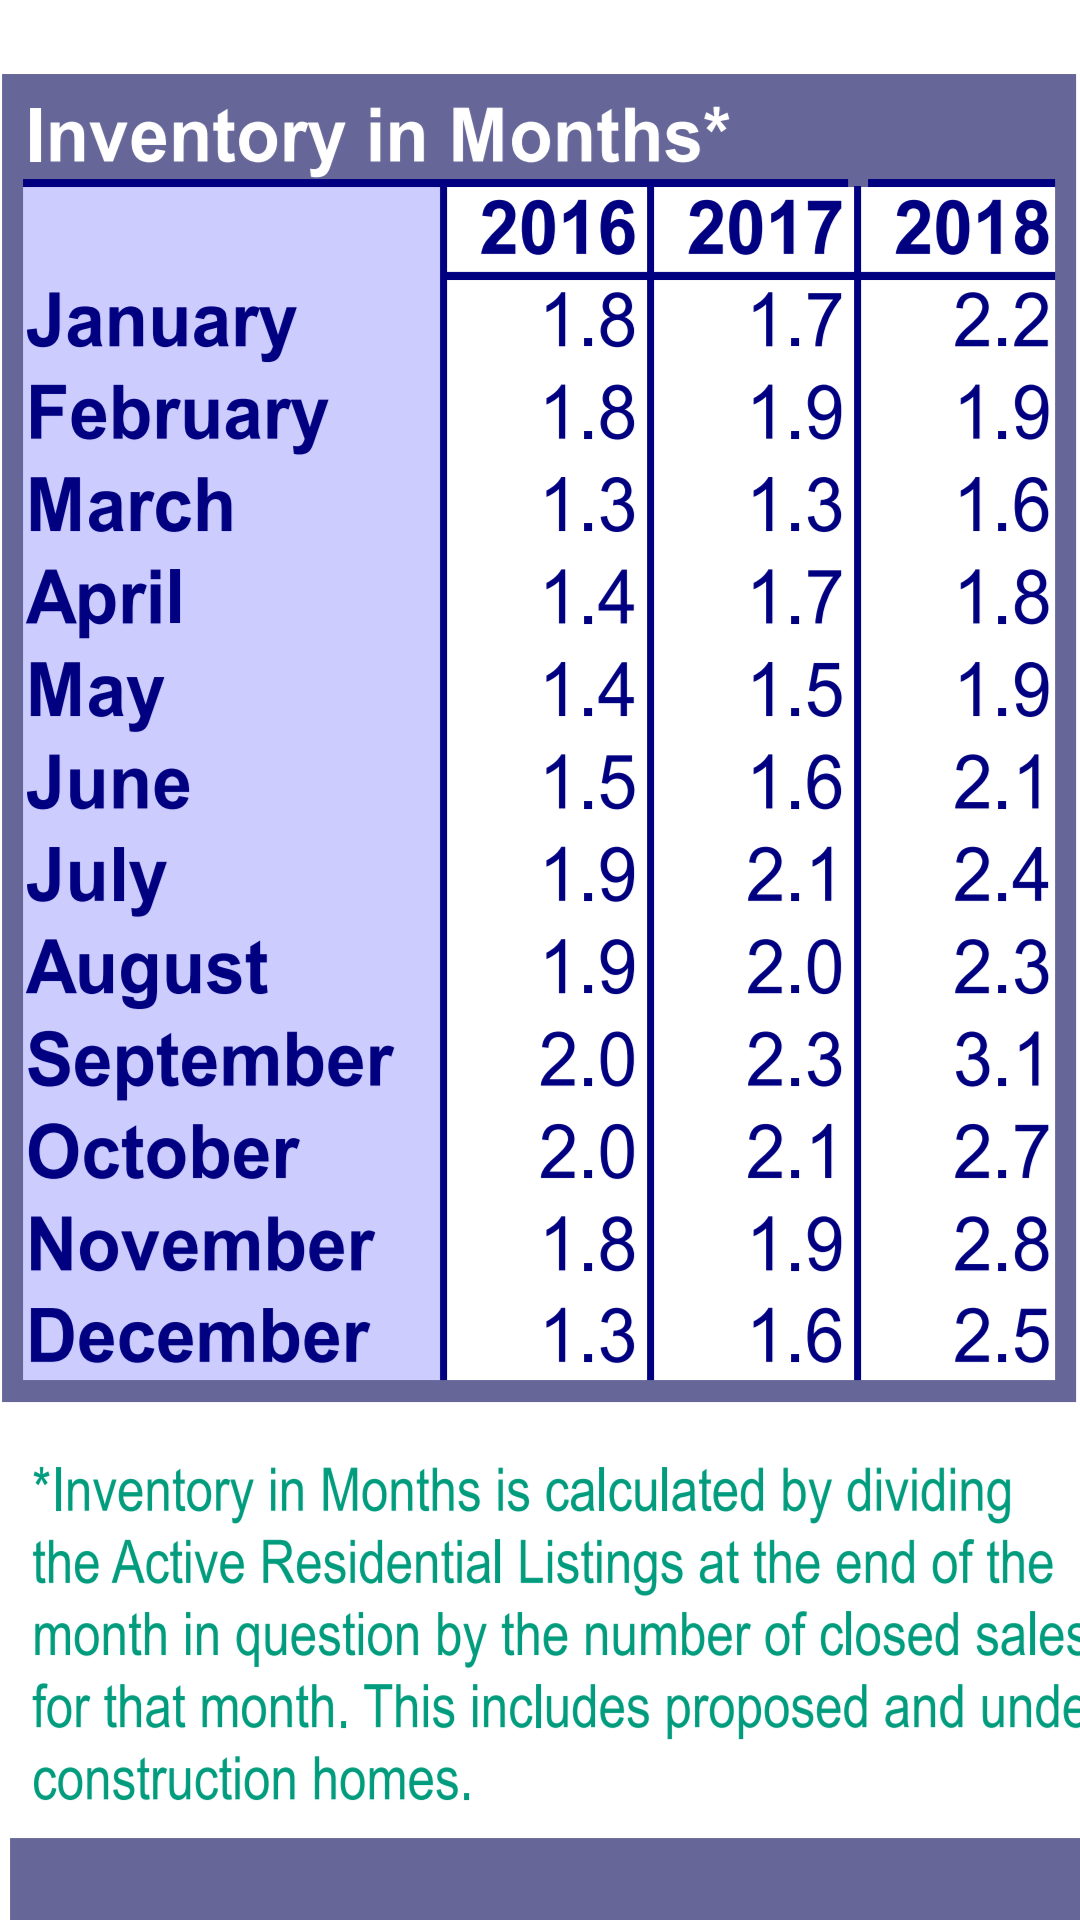
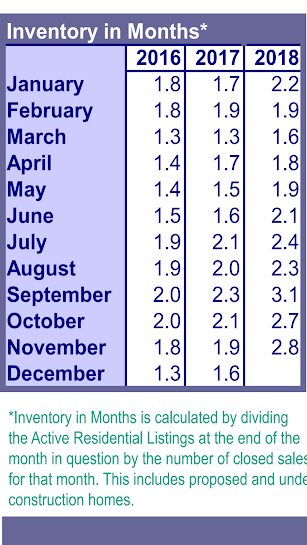
Every January we get to take a look at how the numbers shook out for the prior year. The winter/holiday months always bring some cooling, and/but we also get to look at a full year-to-year comparison at this juncture.
OVERVIEW: Things have leveled-out a bit from 2017 to 2018 but homes are appreciating in value, inventory is high, and anecdotally, the general consensus is that Buyers are out in force and we are seeing lots of activity including some multiple offers for well-priced homes. Rates are also pretty good right now according to my Lending pals, and prices, while not going up quite as fast anymore, are generally still profitable for Sellers and a little more affordable for Buyers. Overall, when the market is more predictable, it is good for everyone!
According to the RMLS Market Action Report for the Portland Metro Area:
Neighborhoods: December’s Average Sale Price + 12-month Appreciation:
North Portland: $388,700 4.3% (Nov 412,500 / Dec ’17: 400,500 5.9%) YTD Median: $400,000
NE Portland: $450,600 4.0% (Nov 453,100 / Dec ’17: 430,000, 8.1%) YTD Median: $415,000
SE Portland: $425,900 5.9% (Nov 425,200 / Dec ’17: 382,200 8.7%) YTD Median: $375,000
Gresham/Troutdale: $338,500 7.7% (Nov 361,600 / Dec ’17: 329,600 10.4%) YTD Median: $340,000
Milwaukie/Clackamas: $427,500 4.6% (Nov 443,400 / Dec ’17: 411,500, 9.1%) YTD Median: $400,000
Oregon City/Canby: $428,600 7.1% (Nov 427,200 / Dec ’17: 402,100 7.2%) YTD Median: $392,500
Lake Oswego/West Linn: $636,300 0.6% (Nov 728,500 / Dec ’17: 662,700 9.5%) YTD Median: $580,000
West Portland: $588,800 3.8% (Nov 601,000 / Dec ’17: 612,700 3.2%) YTD Median: $519,000
NW Wash County: $483,400 2.5% (Nov 511,700 / Dec ’17: 534,400 7.7%) YTD Median: $520,000
Beaverton/Aloha: $381,600 8.6% (Nov 397,200 / Dec ’17: 363,200 9.2%) YTD Median: $375,000
Tigard/Wilsonville: $459,600 6.3% (Nov 482,000 / Dec ’17: 435,700 7.7%) YTD Median: $430,000
Hillsboro/Forest Grove: $382,100 5.9% (Nov 381,300 / Dec ’17: 366,800 11.0%) YTD Median: $372,000
Linda Rossi – January 5, 2019
![]()
Of course we think we’re #1 because we love it here. And/but #2 may be getting us a bit too much attention till we can update some of our infrastructure & ease some rental concerns?? So…. we may wish to keep Portland to ourselves, but the world is definitely noticing us…
Check out these two Links:
1) WKRN
2) That Oregon Life
Linda Rossi – December 23, 2018
The holidays are all around us now!
Here is your look at the most recent data for the entire Portland area (Nov) and a neighborhood-by-neighborhood breakdown just below it. (***End-of-Year Numbers/Dec will be out on or about Jan 15th)
According to the RMLS Market Action Report for the Portland Metro Area, November, 2018:
Neighborhoods: November’s Average Sale Price + 12-month Appreciation:
Linda Rossi – December 15, 2018

Linda Rossi – December 12, 2018