Overview/Fluctuations ~ Market Data June 2021
Here is your look at the latest data covering the greater Portland area according to RMLS. Specific information on Neighborhoods is broken out below.
New Listings and Closings increased in June, and/but Accepted Offers (Pendings) decreased from last year’s June figures as well as from May.
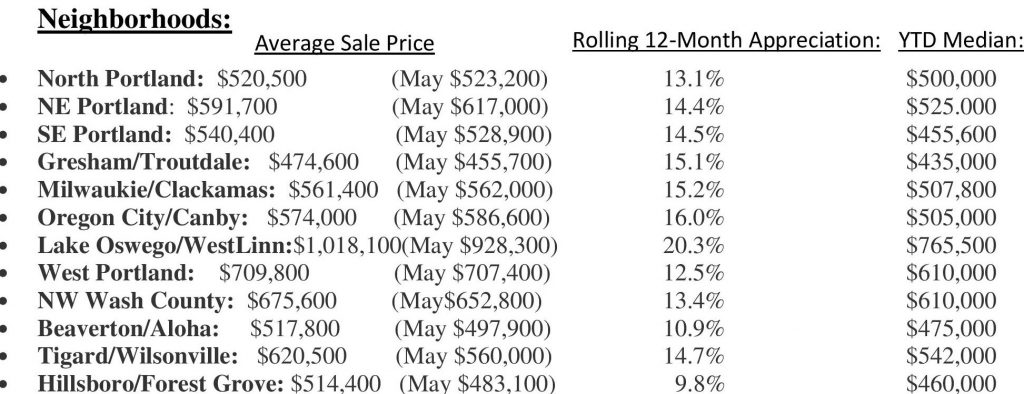
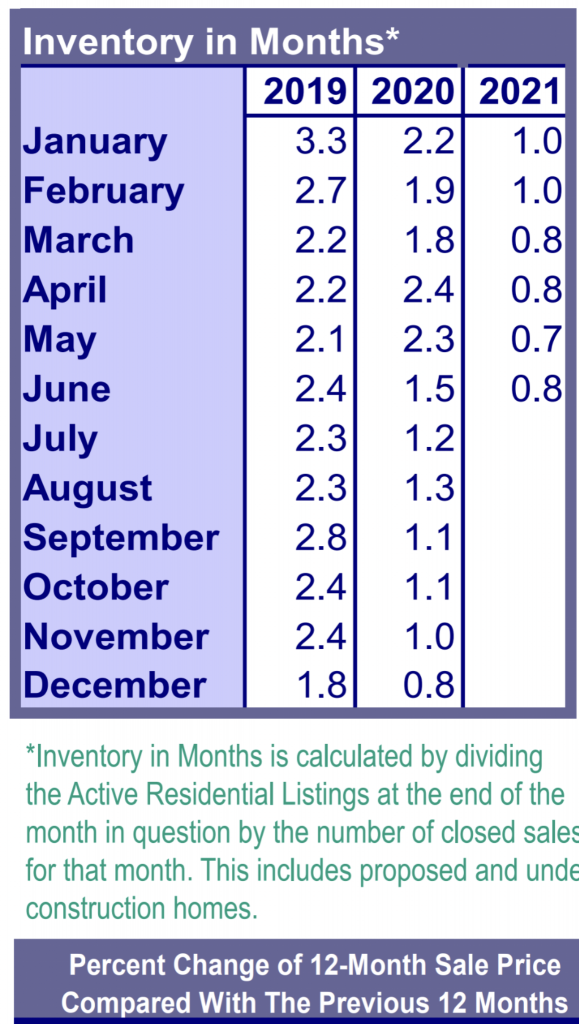
Inventory rose a whopping .1% in June (ha ha). We’re still at record (record) lows. While we’re talking records, check out those neighborhood appreciation levels below. Just wow.
My trusted mortgage advisor says rates are down a bit to 3.0%! Fed is indicating that they’ll continue to support the markets as the job picture improves.
- There were 4,298 New Listings in June 2021 increased 17.5% over April 2020’s 3,658 and increased 8.2% from the previous month/May’s 3,971.
- At 3,477, June 2021’s Closed Sales are up 28.3% from June 2020’s 2,709, and also up 9.2% from the previous month/May’s total of 3,183
- At 3,534, June 2021’s Pending Sales decreased 3.3% from June 2020’s 3,654, and also dropped 4.9% from the previous month/May’s total of 3,717.
- The Average Sale Price in June 2021 of $597,100 is up $117,400 from last year/June2020’s $479,700, and up $14,900. from the previous month/May’s $582,200.
- The “Median” Sale Price (the price smack dab in the middle of all sales) in June 2021 of $521,000 rose $86,000 from last year/June 2020’s $435,000, and also increased $6,000 from the previous month/May’s $515,000.