Linda Rossi – July 18, 2020

Getting You Where You Want To Go
Linda Rossi – July 18, 2020
Linda Rossi – July 12, 2020


Linda Rossi – June 25, 2020
Linda Rossi – June 22, 2020
3 Days on the market.

Linda Rossi – June 12, 2020
Sold in 8 Days~
Linda Rossi – May 24, 2020
Linda Rossi – May 11, 2020

There are lots of great reasons to buy a home.
The reasons you’ll usually hear are practical and financial ones like:
These are all very good reasons! But, as I read recently, if financial considerations were the only motivator, we’d all “Buy Low/Sell High” every single time. We don’t do that. I mean, sometimes the circumstances are just right for us to do that & that’s fabulous! But mostly people buy homes for the following reasons:
So… all of these reasons revolve around making your Life better. That’s why I always say I help people change their lives through buying or selling real estate. Its just what its all about ; )
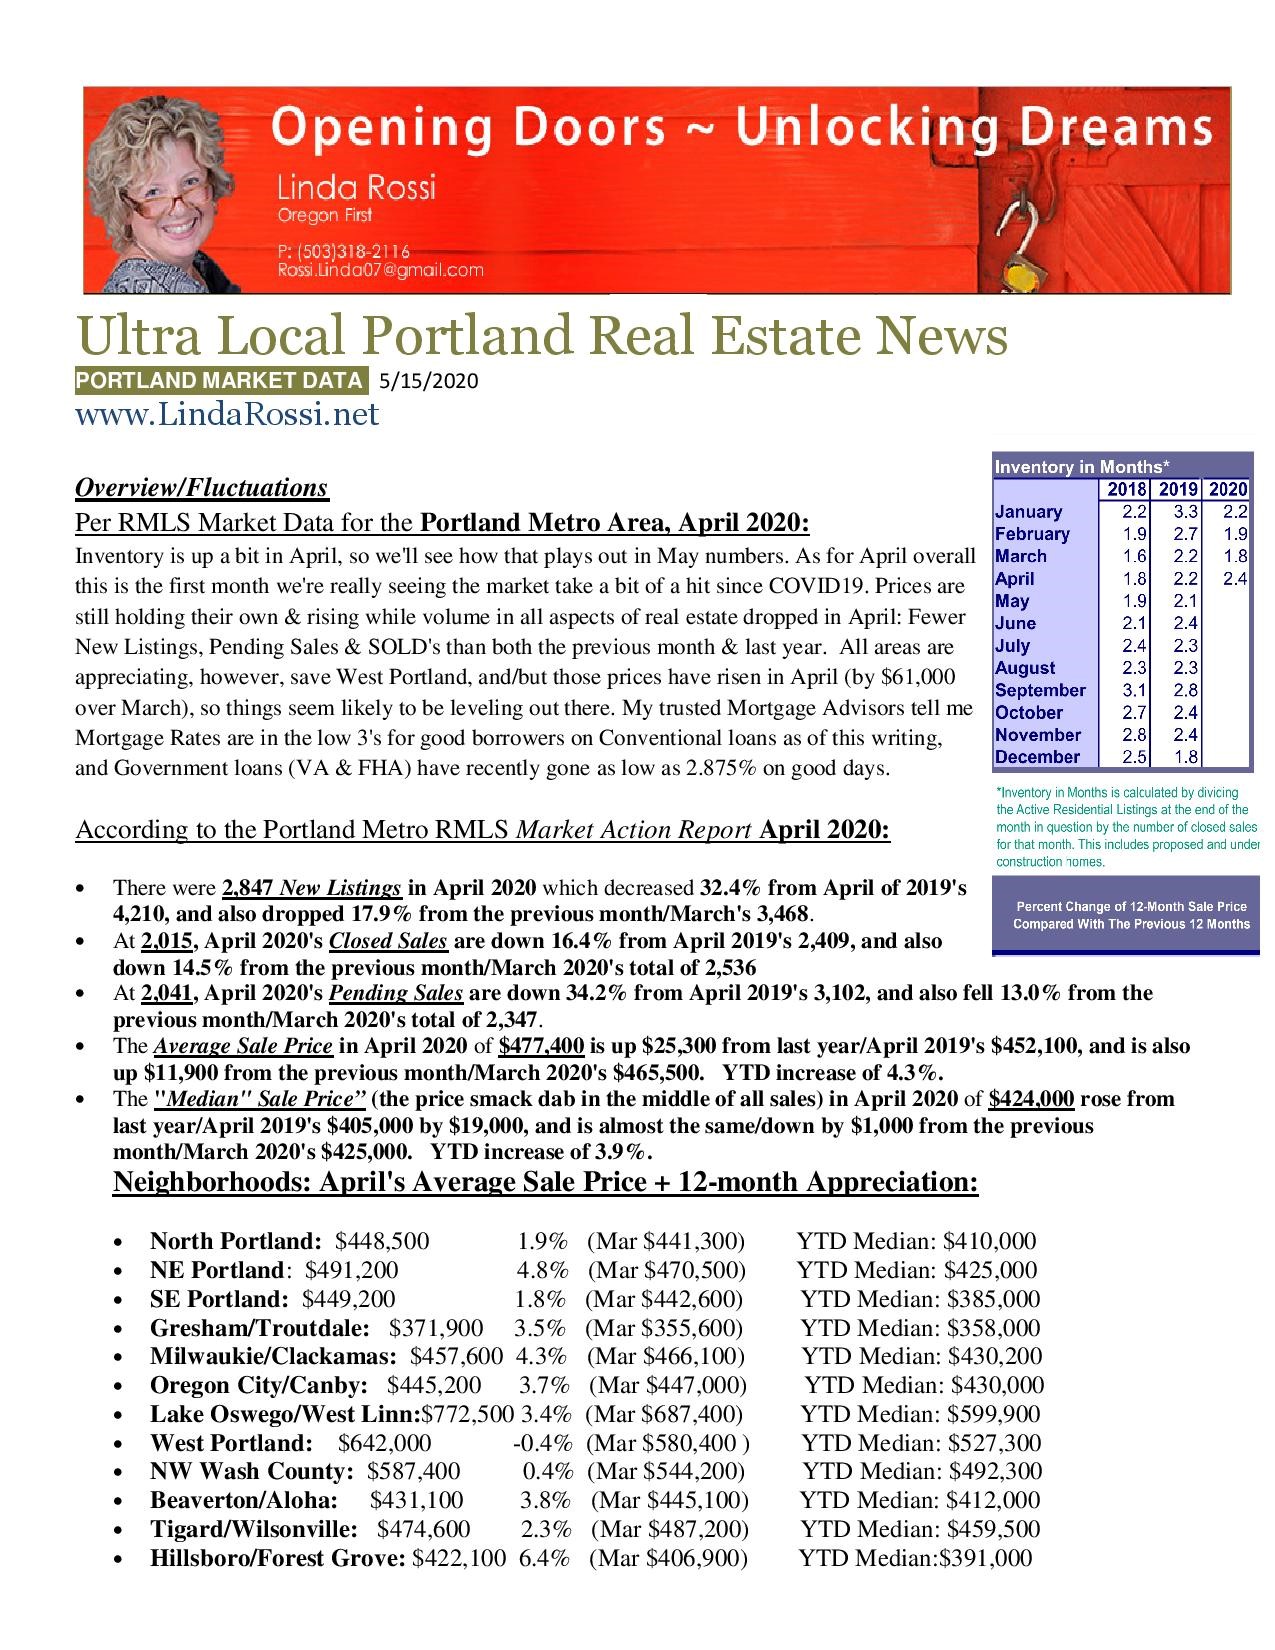
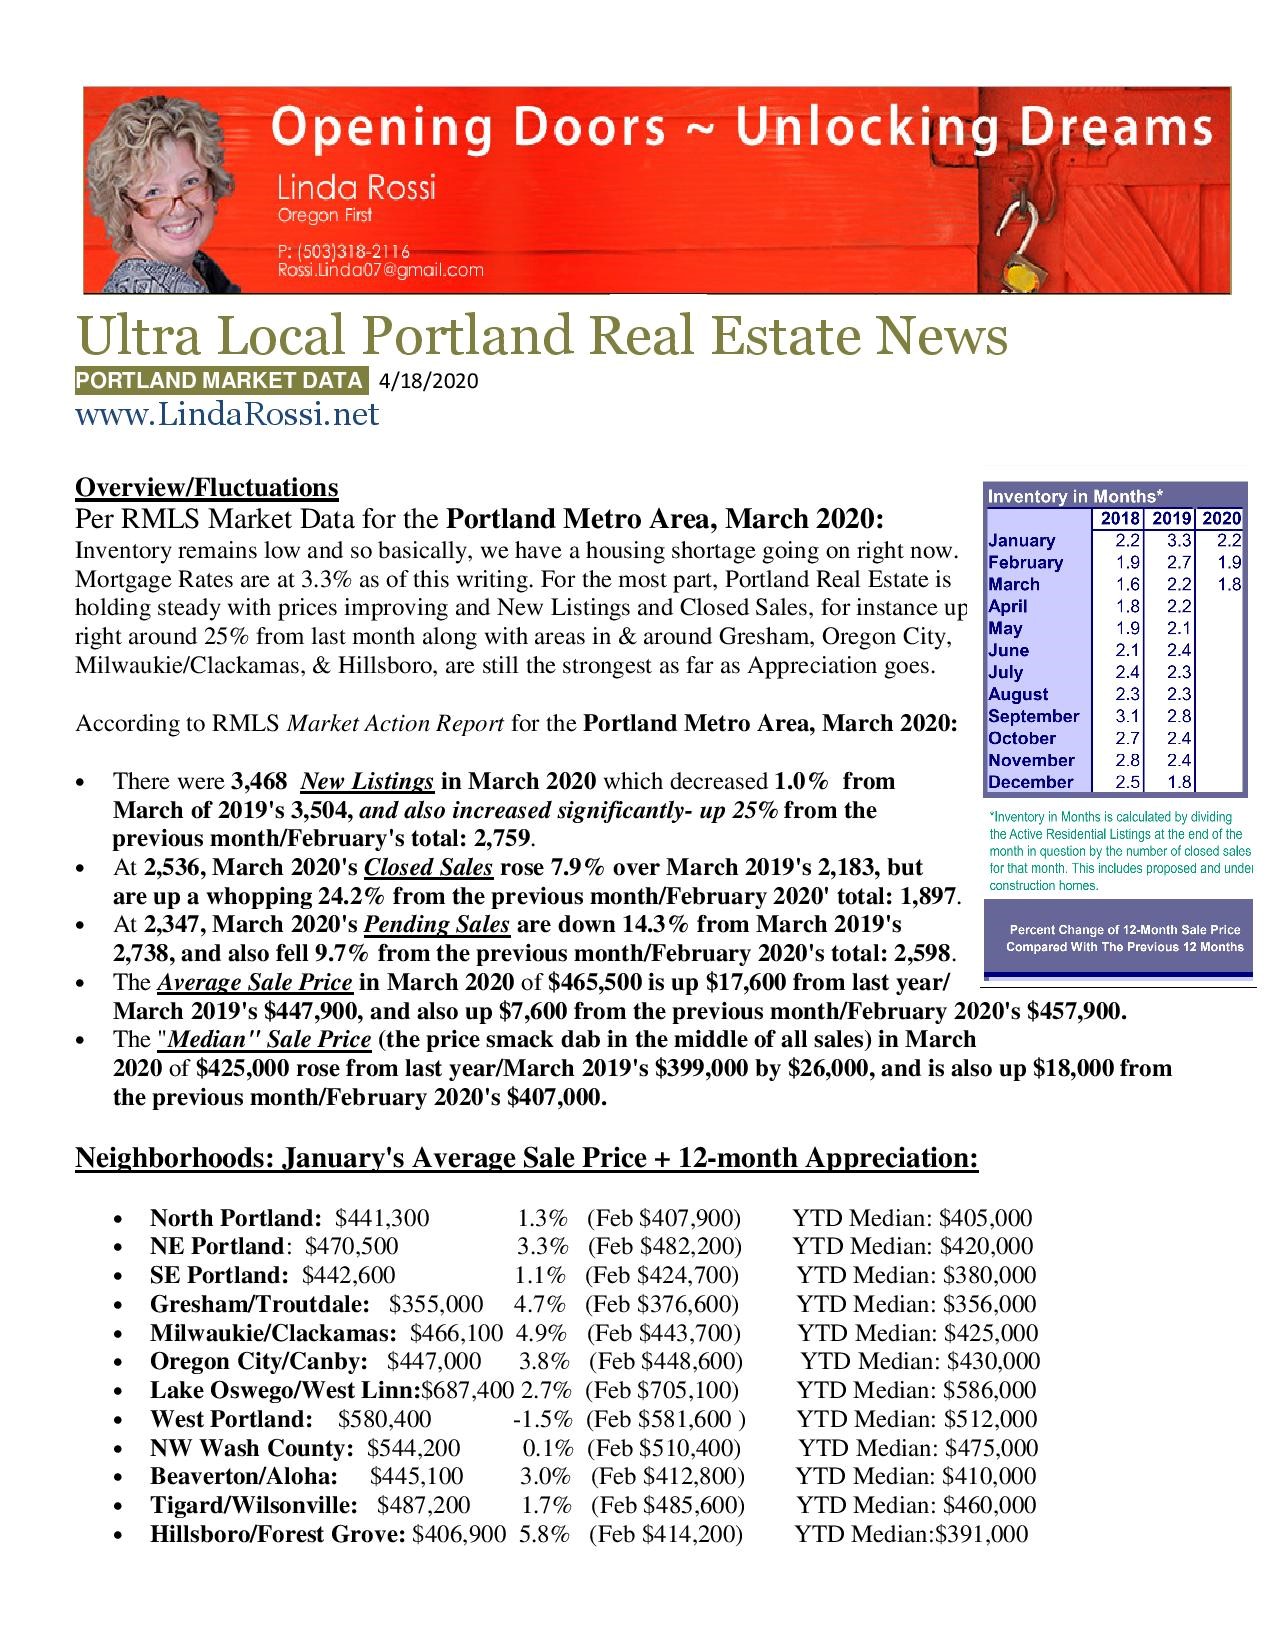
Linda Rossi – April 18, 2020
Linda Rossi – April 12, 2020

As we all slow down a bit, most of us celebrate renewal this time of year with Easter, Passover or other traditions. As I was out showing properties today, I was noticing the way we really are all in this together. Standing six feel apart with our masks on, I slowly and carefully remove the keys from the lockbox with a sanitizing wipe and move through all the precautions we are taking nowadays… fresh booties at each house, gloves, more wipes, hand sanitizer… We carefully tiptoe into people’s homes pondering if this one might be “the one”, careful to respect the human life that inhabits each home and leaving everything untouched and “safe” for those who follow behind or return home. We are all slowed down together. Still moving forward with our various dreams and plans… just a little slower and a bit more thoughtfully. Considering each other slightly more seriously. Considering ourselves. It is a very sweet realization amid the madness… to see and to help the dreams unfold, and again to notice the truth of the fact that we really are all in this together.
How poignant the holiday of renewal at this moment in time.
May each of our my readers be safe & healthy, and may your dreams stay intact and your plans proceed unhindered. My hope is that we all emerge with a renewed & lasting appreciation for each other and our unique yet intertwined lives in the years ahead.

Linda Rossi – March 29, 2020

Dear Clients & Friends,
Know that I’m thinking of you during this challenging moment & wishing health and peace to you and yours. I hope this is a time of staying at home with your loved ones & enjoying some things you usually don’t get to enjoy.
I’m told by my trusted Mortgage Advisors that mortgage interest rates are supposed to dip to 3-ish again shortly as that zero interest rate flushes out the crush that happened a few weeks ago when they went down that low (the saturation pushed them back up to 4-ish for a time).
Sales are actually moving along really well in the overall Portland area right now. Prices are lowering in some cases and being pushed up in others with multiple offers. In other words- the usual. In the Last 7 Day Period: we have 505 New Properties hitting the market, 391 that have moved to Pending status (*Average Days-on-Market 32), and 362 that have Closed/Sold (*Average Days-On-Market till “Pending” 63). *Being as we have an approx 30-45 day time lapse between when a property goes Pending & when its Closed, I’d say these “Days-On-Market” numbers from last week indicate that houses are selling faster all of a sudden.
The other day RMLS removed the Open House section from the site. Some Agents will still choose to have them and be very careful, but most are not doing so out of an appropriate abundance of caution, for now. Everyone is being extremely careful with sanitizing everything and following Seller guidelines for private in-person showings. Buyers are demonstrating a bit more discernment up front & are seeing only properties they’ve decided are on their “serious” list, which cuts down on any potential exposure for everyone as we all do our part. Typically hand-sanitizer is out, booties are used for shoes, Buyers are advised not to touch anything (for them and for the Seller) and Agents will generally wipe the lockbox, door handles, switches etc. Buyers are encouraged to bring their own wipes & sanitizer with them and to wear gloves and/or masks as warranted either by Seller instruction or their own sensibilities. Some Sellers will want their own Agent at showings to observe that nothing is touched in the home so that their Seller can return home with their mind at ease, and/but either way, Agents are doing their utmost to ensure safe protocols are followed.
As for promoting Listings, there are, of course, cool tools that can and are being promoted more liberally like Virtual Open Houses, Video Walk-Through’s and other things. Ask me if you’re interested in learning more about that.
In general, we all are in this together, and the camaraderie at-a-distance and diligence in every sector of the real estate community is truly impressive ~ People helping people fulfill their life-goals and stay safe & healthy in the process.
Please take care and pick up the phone or shoot me an email if you have a life-goal you don’t really want to put off ; ) We can make it happen, efficiently and safely.
Be Well~
Linda