Linda Rossi – March 15, 2020


Getting You Where You Want To Go
Linda Rossi – March 15, 2020
Linda Rossi – March 14, 2020
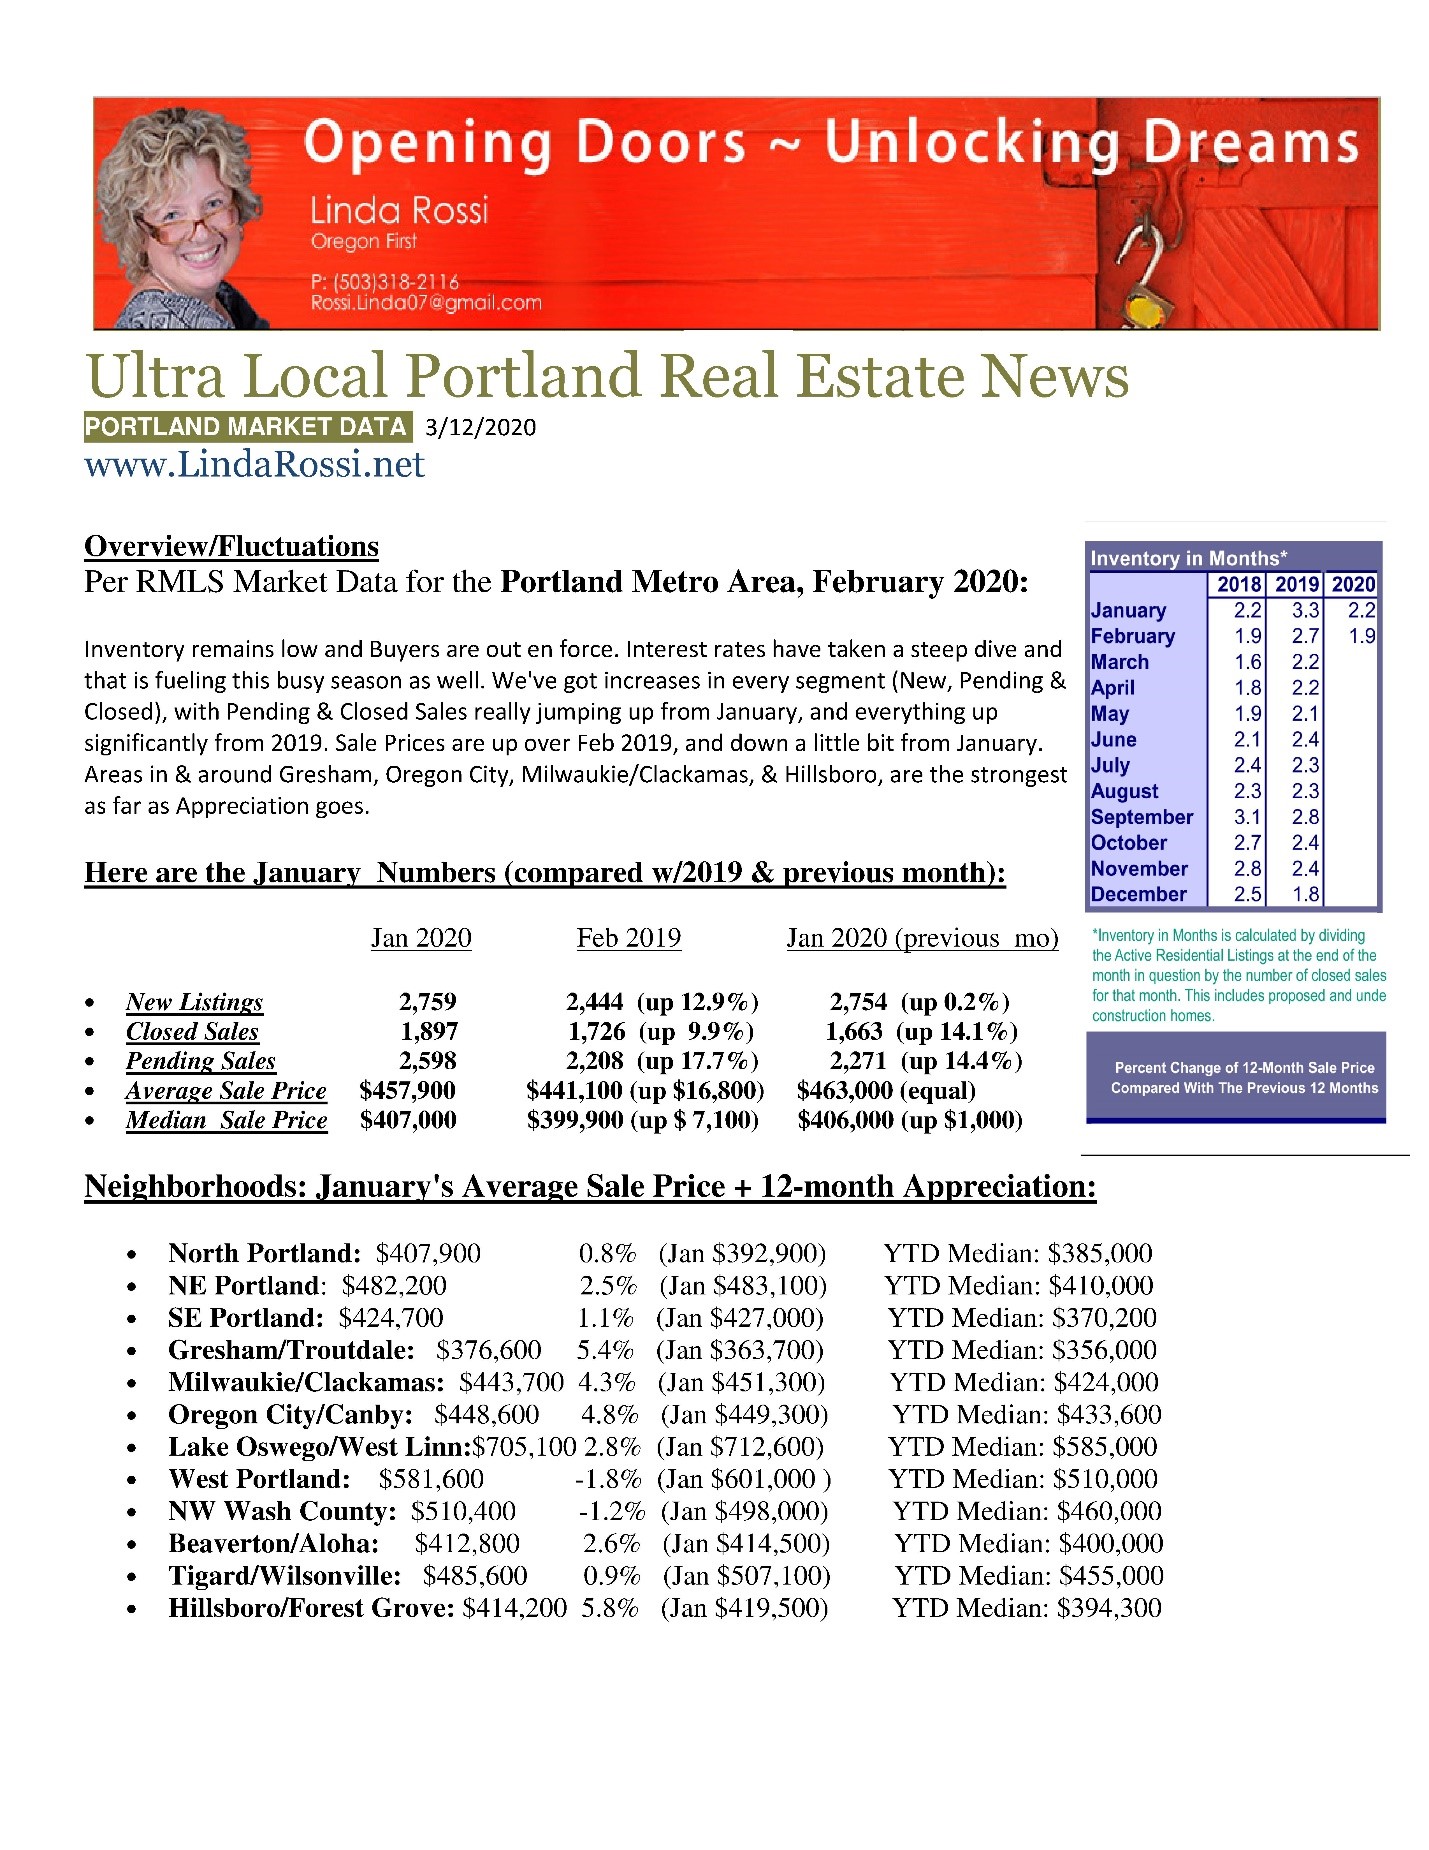
Linda Rossi – March 3, 2020

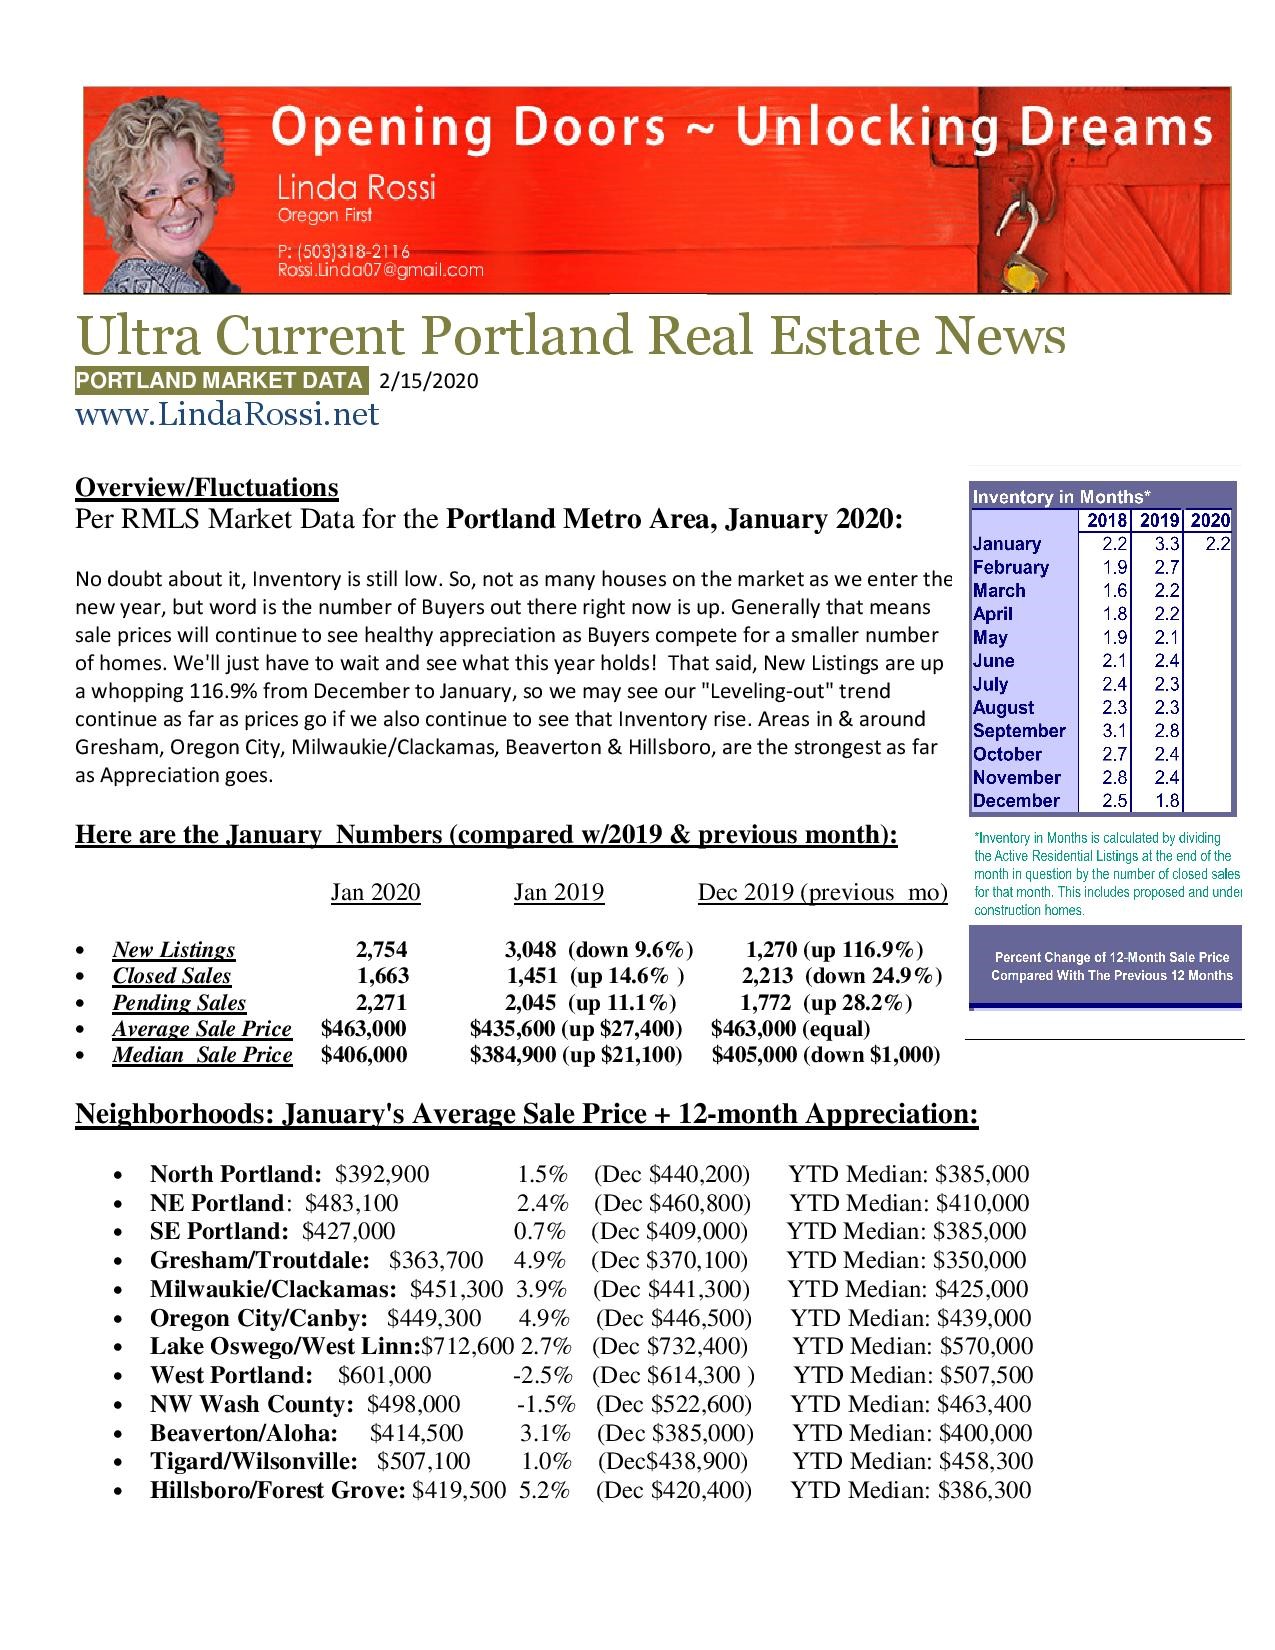
Linda Rossi – February 15, 2020
Linda Rossi – January 18, 2020
This List is just about exactly what I’d come up with myself! Check it out~ CLICK HERE

Linda Rossi – January 18, 2020
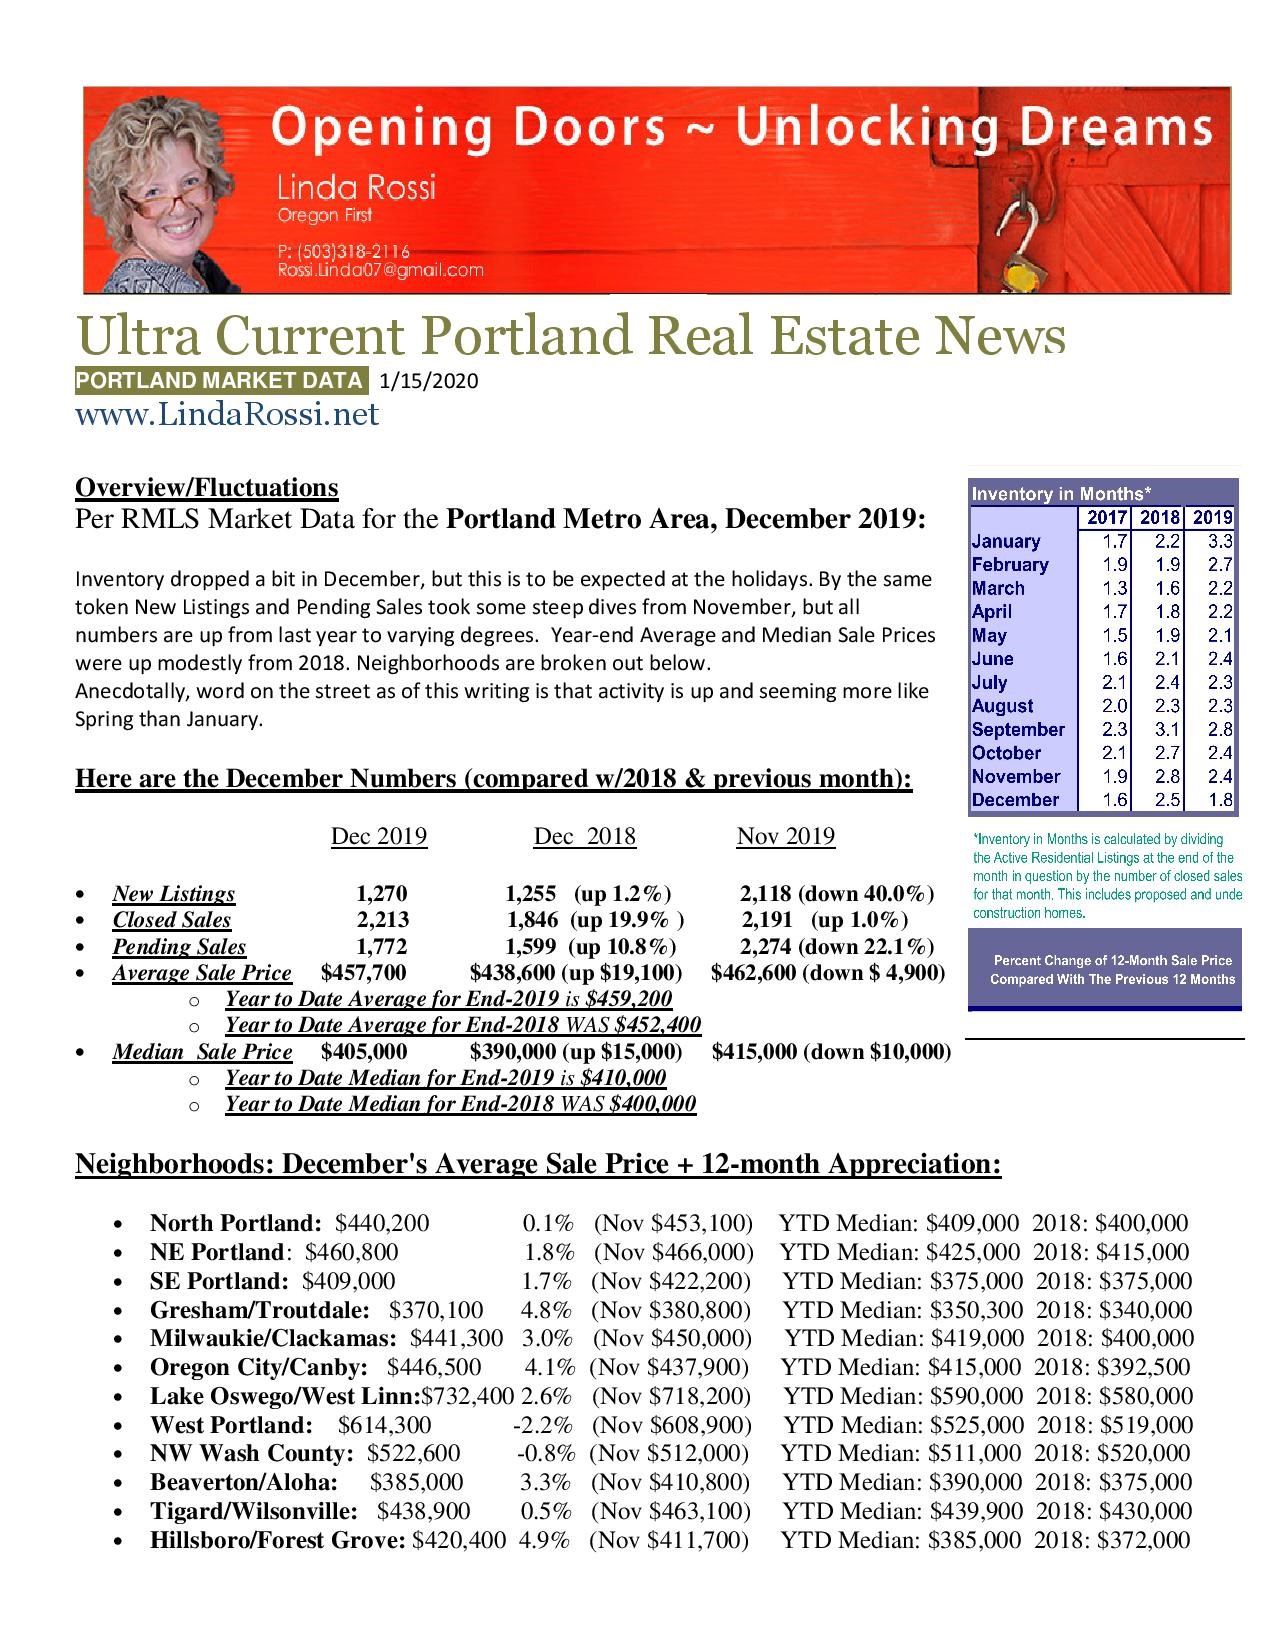
Always the best for my readers & clients! Check out all the numbers below. December gives me the opportunity to compare Year-End Stats with the previous year as well. Every month I also try to break these out into areas of town so that you can see what homes have sold for in your area of interest. Pair the info below w/these previously posted Predictions for 2020~ CLICK HERE
Linda Rossi – January 5, 2020
READ MORE – CLICK HERE
Linda Rossi – November 15, 2019

Linda Rossi – October 27, 2019

Linda Rossi – October 26, 2019