
Linda Rossi – June 15, 2019
Overview/Fluctuations
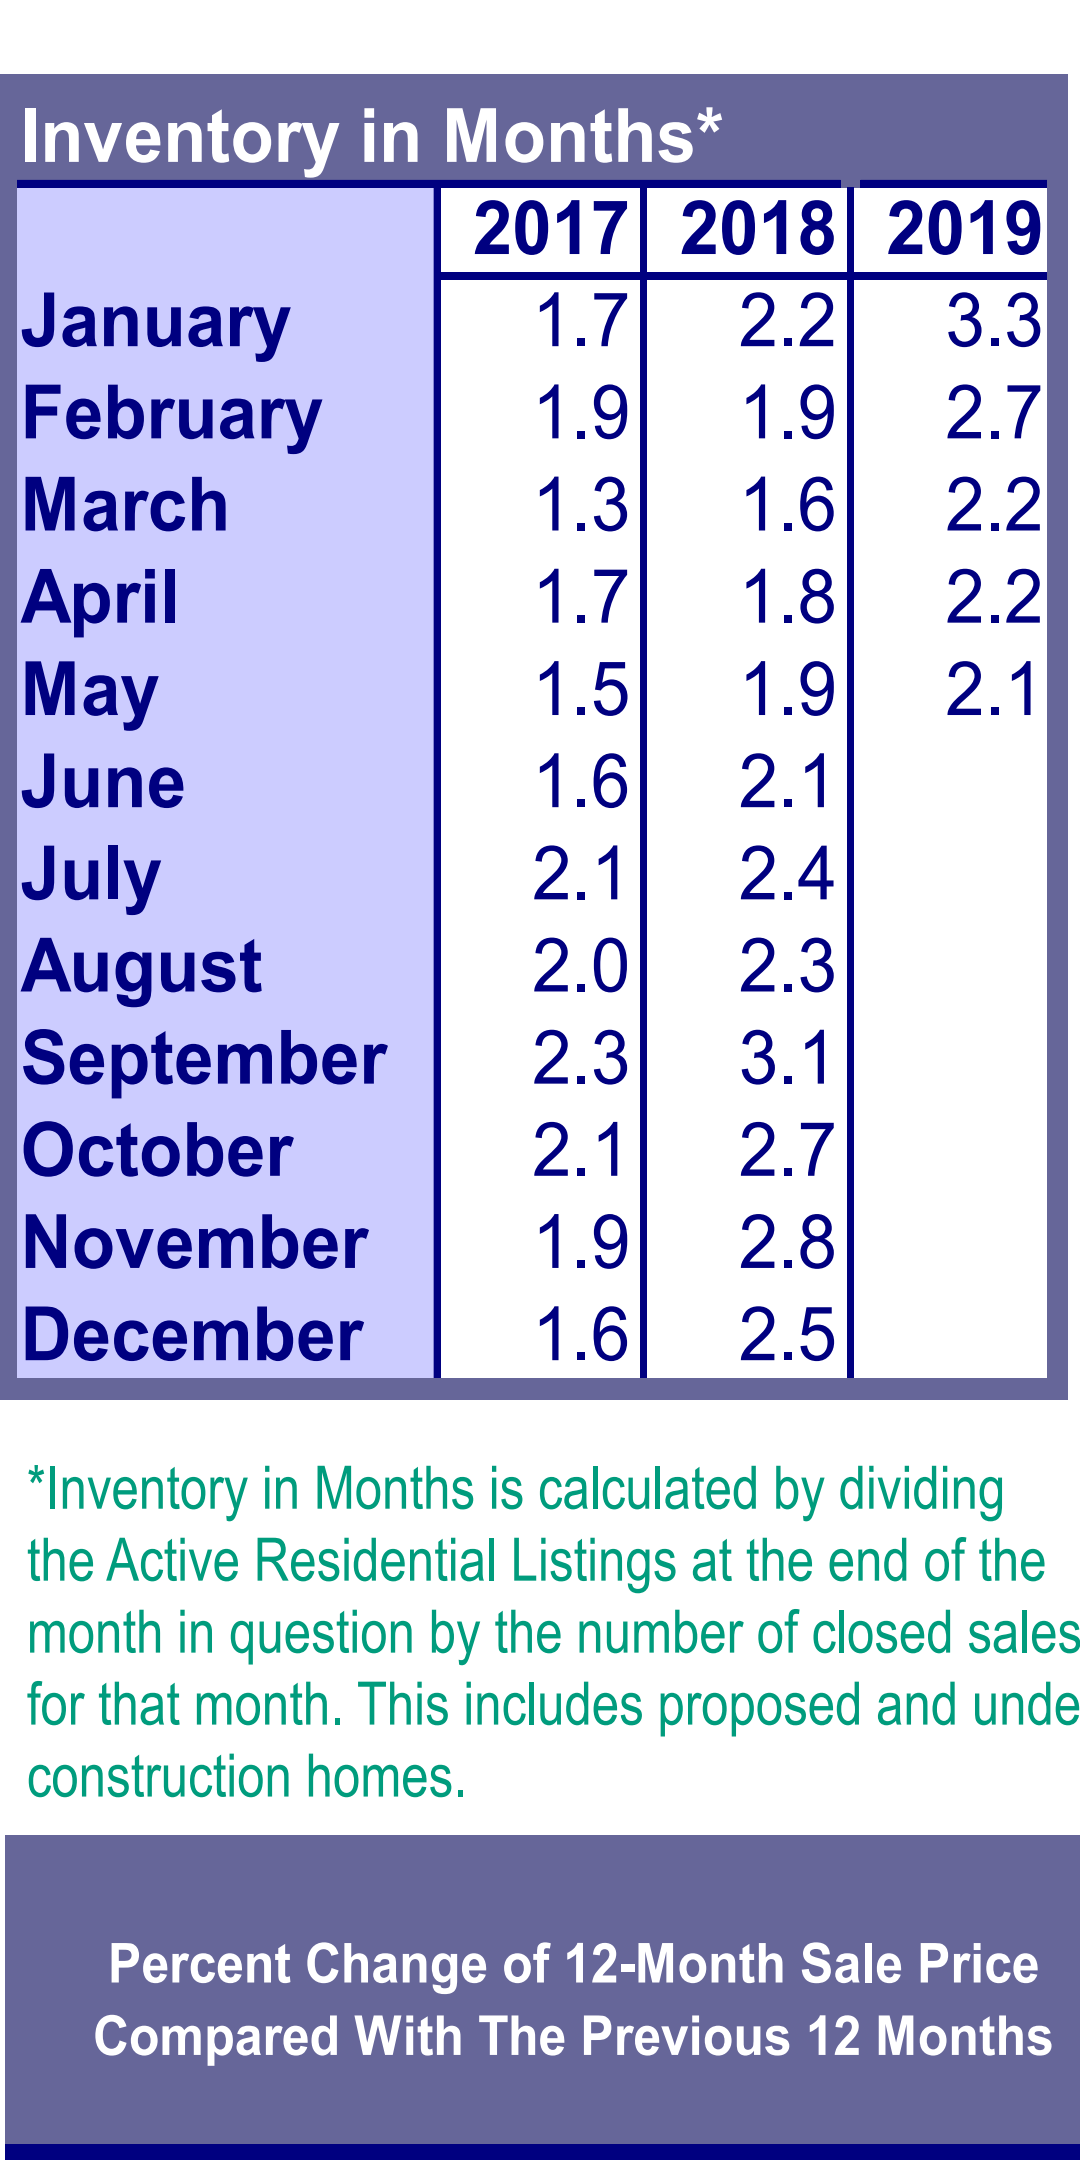
Per RMLS Market Data for the Portland Metro Area, May 2019:
- There were 4,902 New Listings in May 2019 which was up 5.1% from May of 2018’s 4,665, and a whopping 16.4% increase over the previous month/April’s 4,210. (*Strongest May since 2008 which was 5,182.)
- At 2,969 May 2019’s Closed Sales were up 5.9% from May 2018’s 2,803, and again, a whopping 23.2% increase over the previous month/April 2019’s total of 2,409. (*Strongest May since 2006 which was 3,054.)
- May 2019’s Pending Sales (accepted offers), at 3,292 were up 2.8% from May of 2018’s 3,201, and also up 6.1% from the previous month/April 2019’s total of 3,102.
- The Average Sale Price in May 2019 of $471,200 rose $10,500 from last year/May 2018’s $460,700, and was up $19,100 from the previous month/April 2019’s $452,100.
- The “Median” Sale Price (the price smack dab in the middle of all sales) in April 2019 of $420,000 was up from last year/April 2018’s $409,000 by $11,000, and up $15,000.00, from the previous month/April 2019’s $405,000.
Neighborhoods:
May’s Average Sale Price + 12-month Appreciation (and Year-to-Date Median Sale Price):
- North Portland: $426,300 1.6% (Apr 421,300) YTD Median: $405,000
- NE Portland: $534,500 0.7% (Apr 446,800) YTD Median: $406,500
- SE Portland: $433,500 4.2% (Apr 422,100) YTD Median: $373,500
- Gresham/Troutdale: $368,200 5.4% (Apr 390,300) YTD Median: $353,500
- Milwaukie/Clackamas: $444,600 2.6% (Apr 452,900) YTD Median: $409,000
- Oregon City/Canby: $435,700 6.3% (Apr 432,800) YTD Median: $405,000
- Lake Oswego/West Linn:$695,600 0.9% (Apr 654,900) YTD Median: $580,000
- West Portland: $637,800 2.3% (Apr 578,000) YTD Median: $525,000
- NW Wash County: $536,900 -0.4% (Apr 538,500) YTD Median: $510,100
- Beaverton/Aloha: $414,200 7.5% (Apr 393,000) YTD Median: $389,000
- Tigard/Wilsonville: $472,100 3.0% (Apr 467,500) YTD Median: $435,000
- Hillsboro/Forest Grove: $423,400 4.2% (Apr 395,200) YTD Median: $379,900