Linda Rossi – December 10, 2018
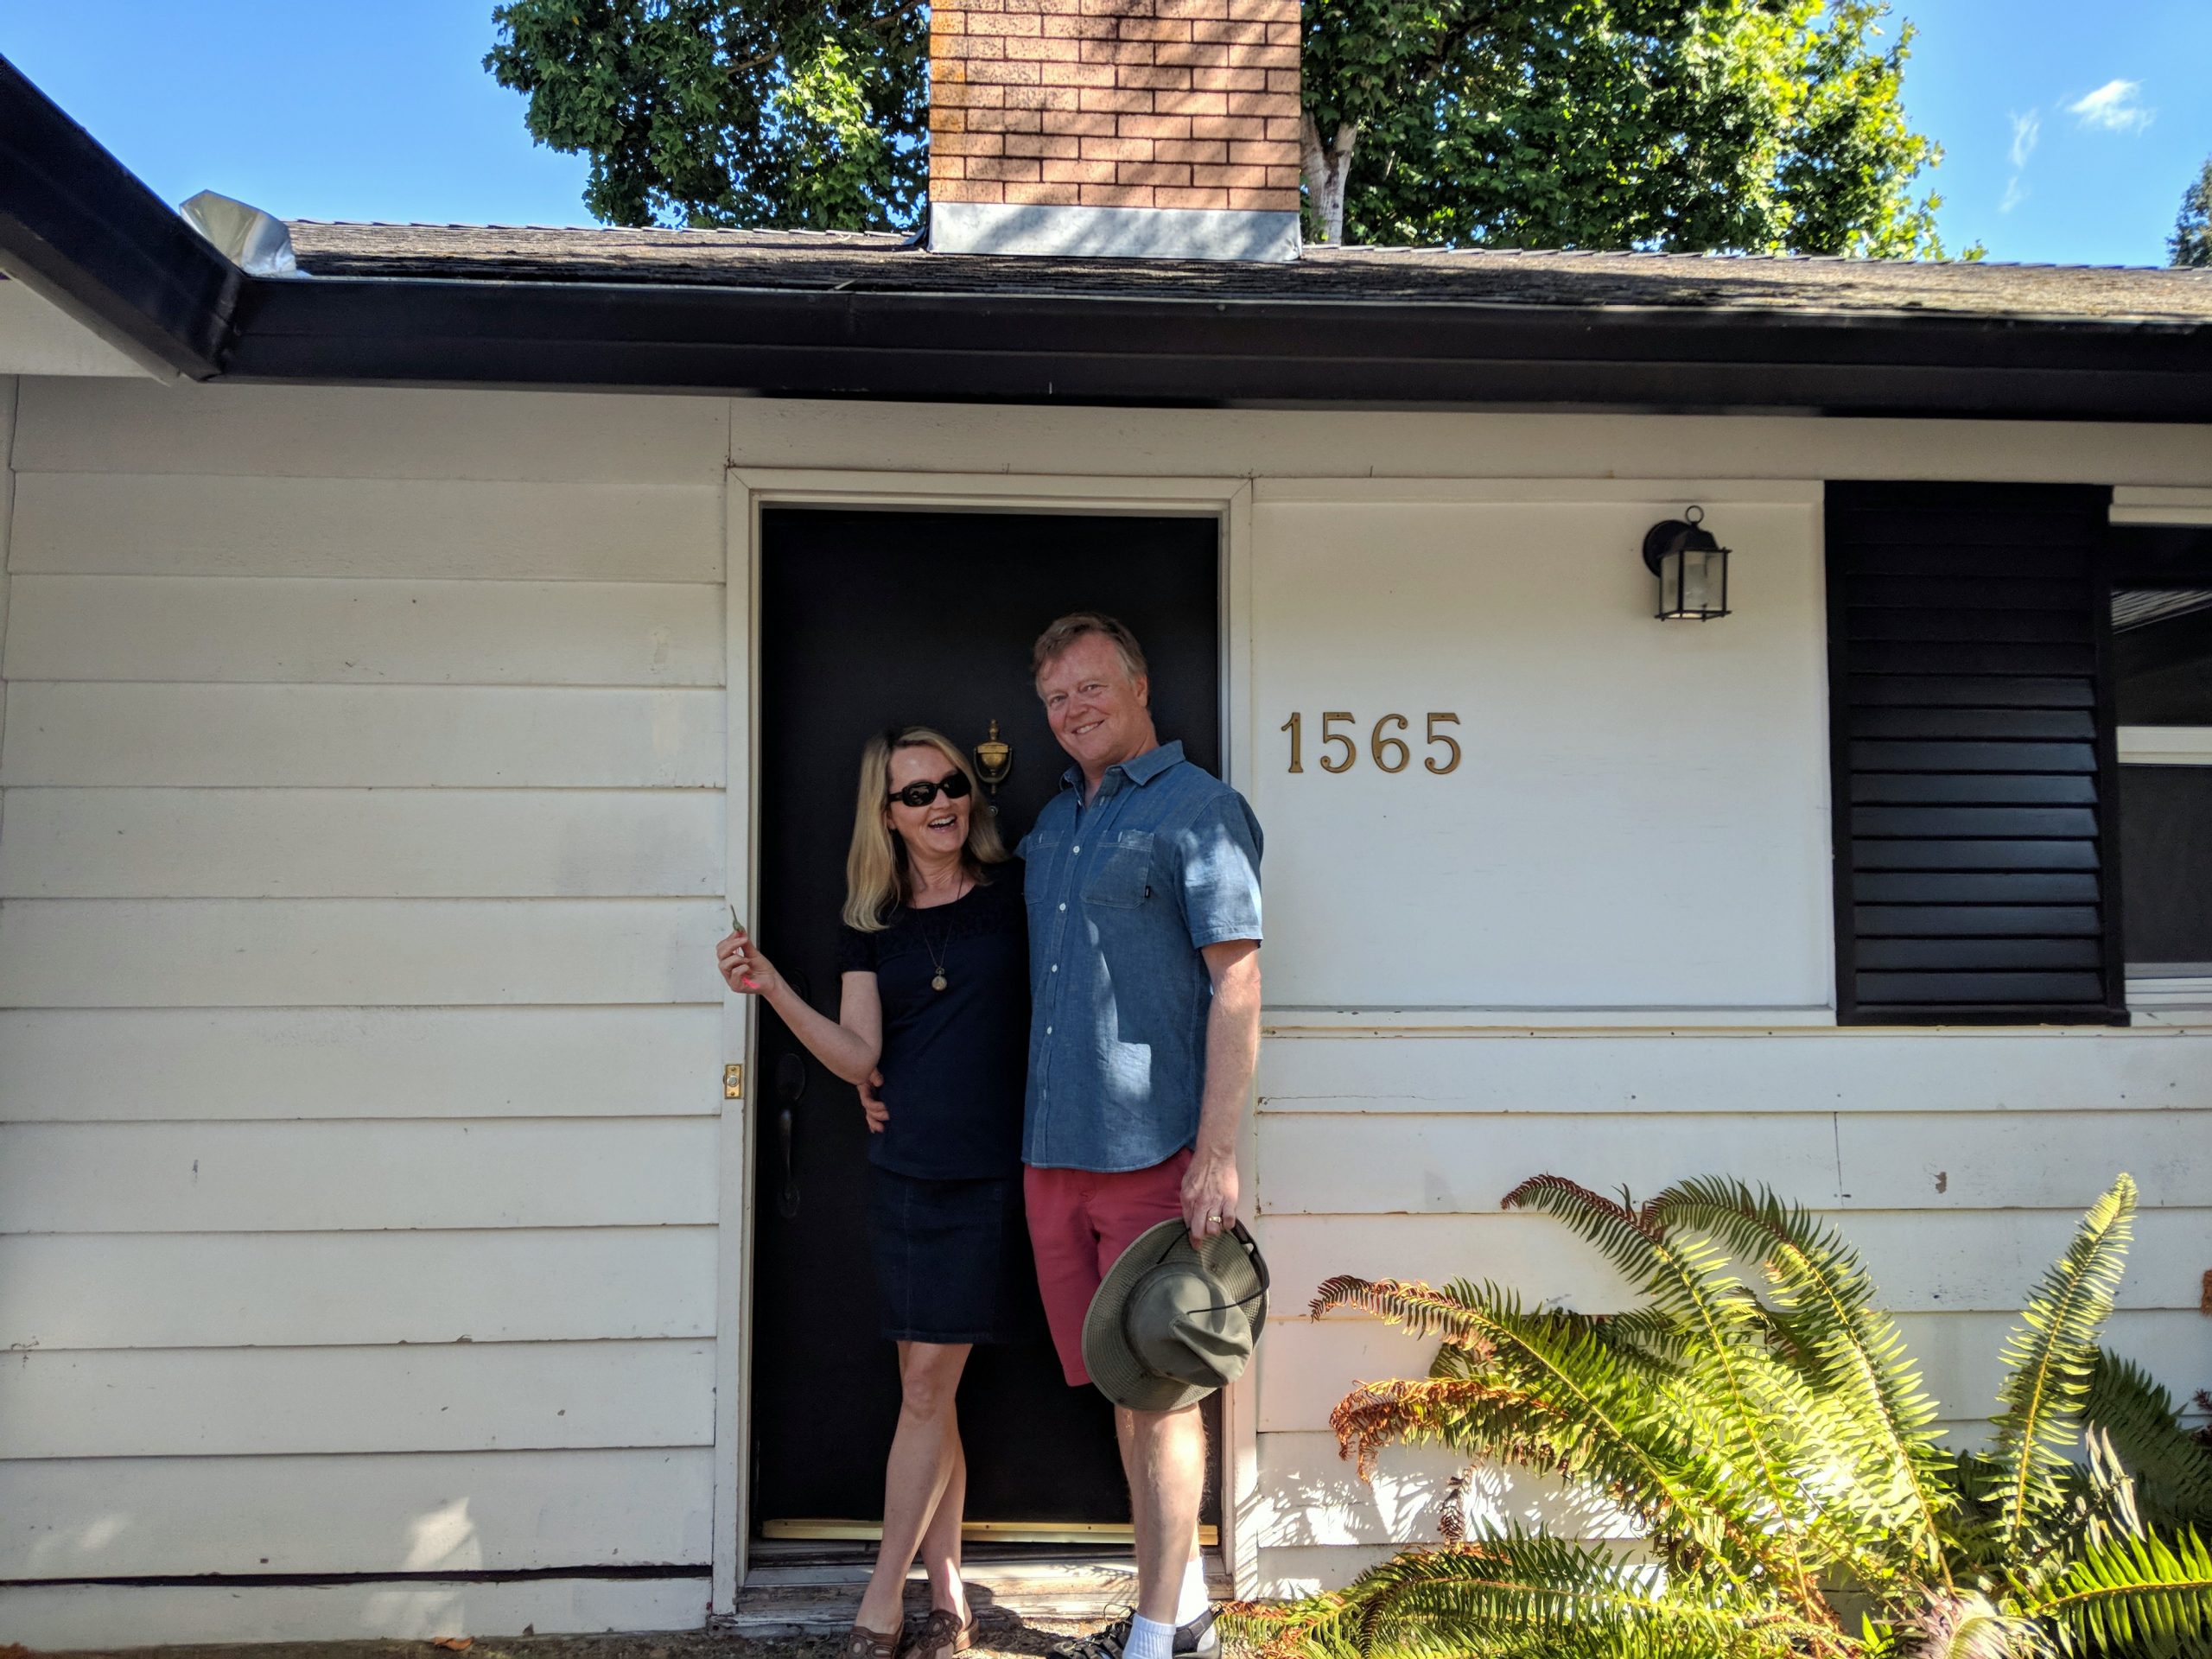
Hey, My clients win. On this one it was a win over 5 other Offers… 4 at the same offer price as ours.

Getting You Where You Want To Go
Linda Rossi – December 10, 2018
Hey, My clients win. On this one it was a win over 5 other Offers… 4 at the same offer price as ours.
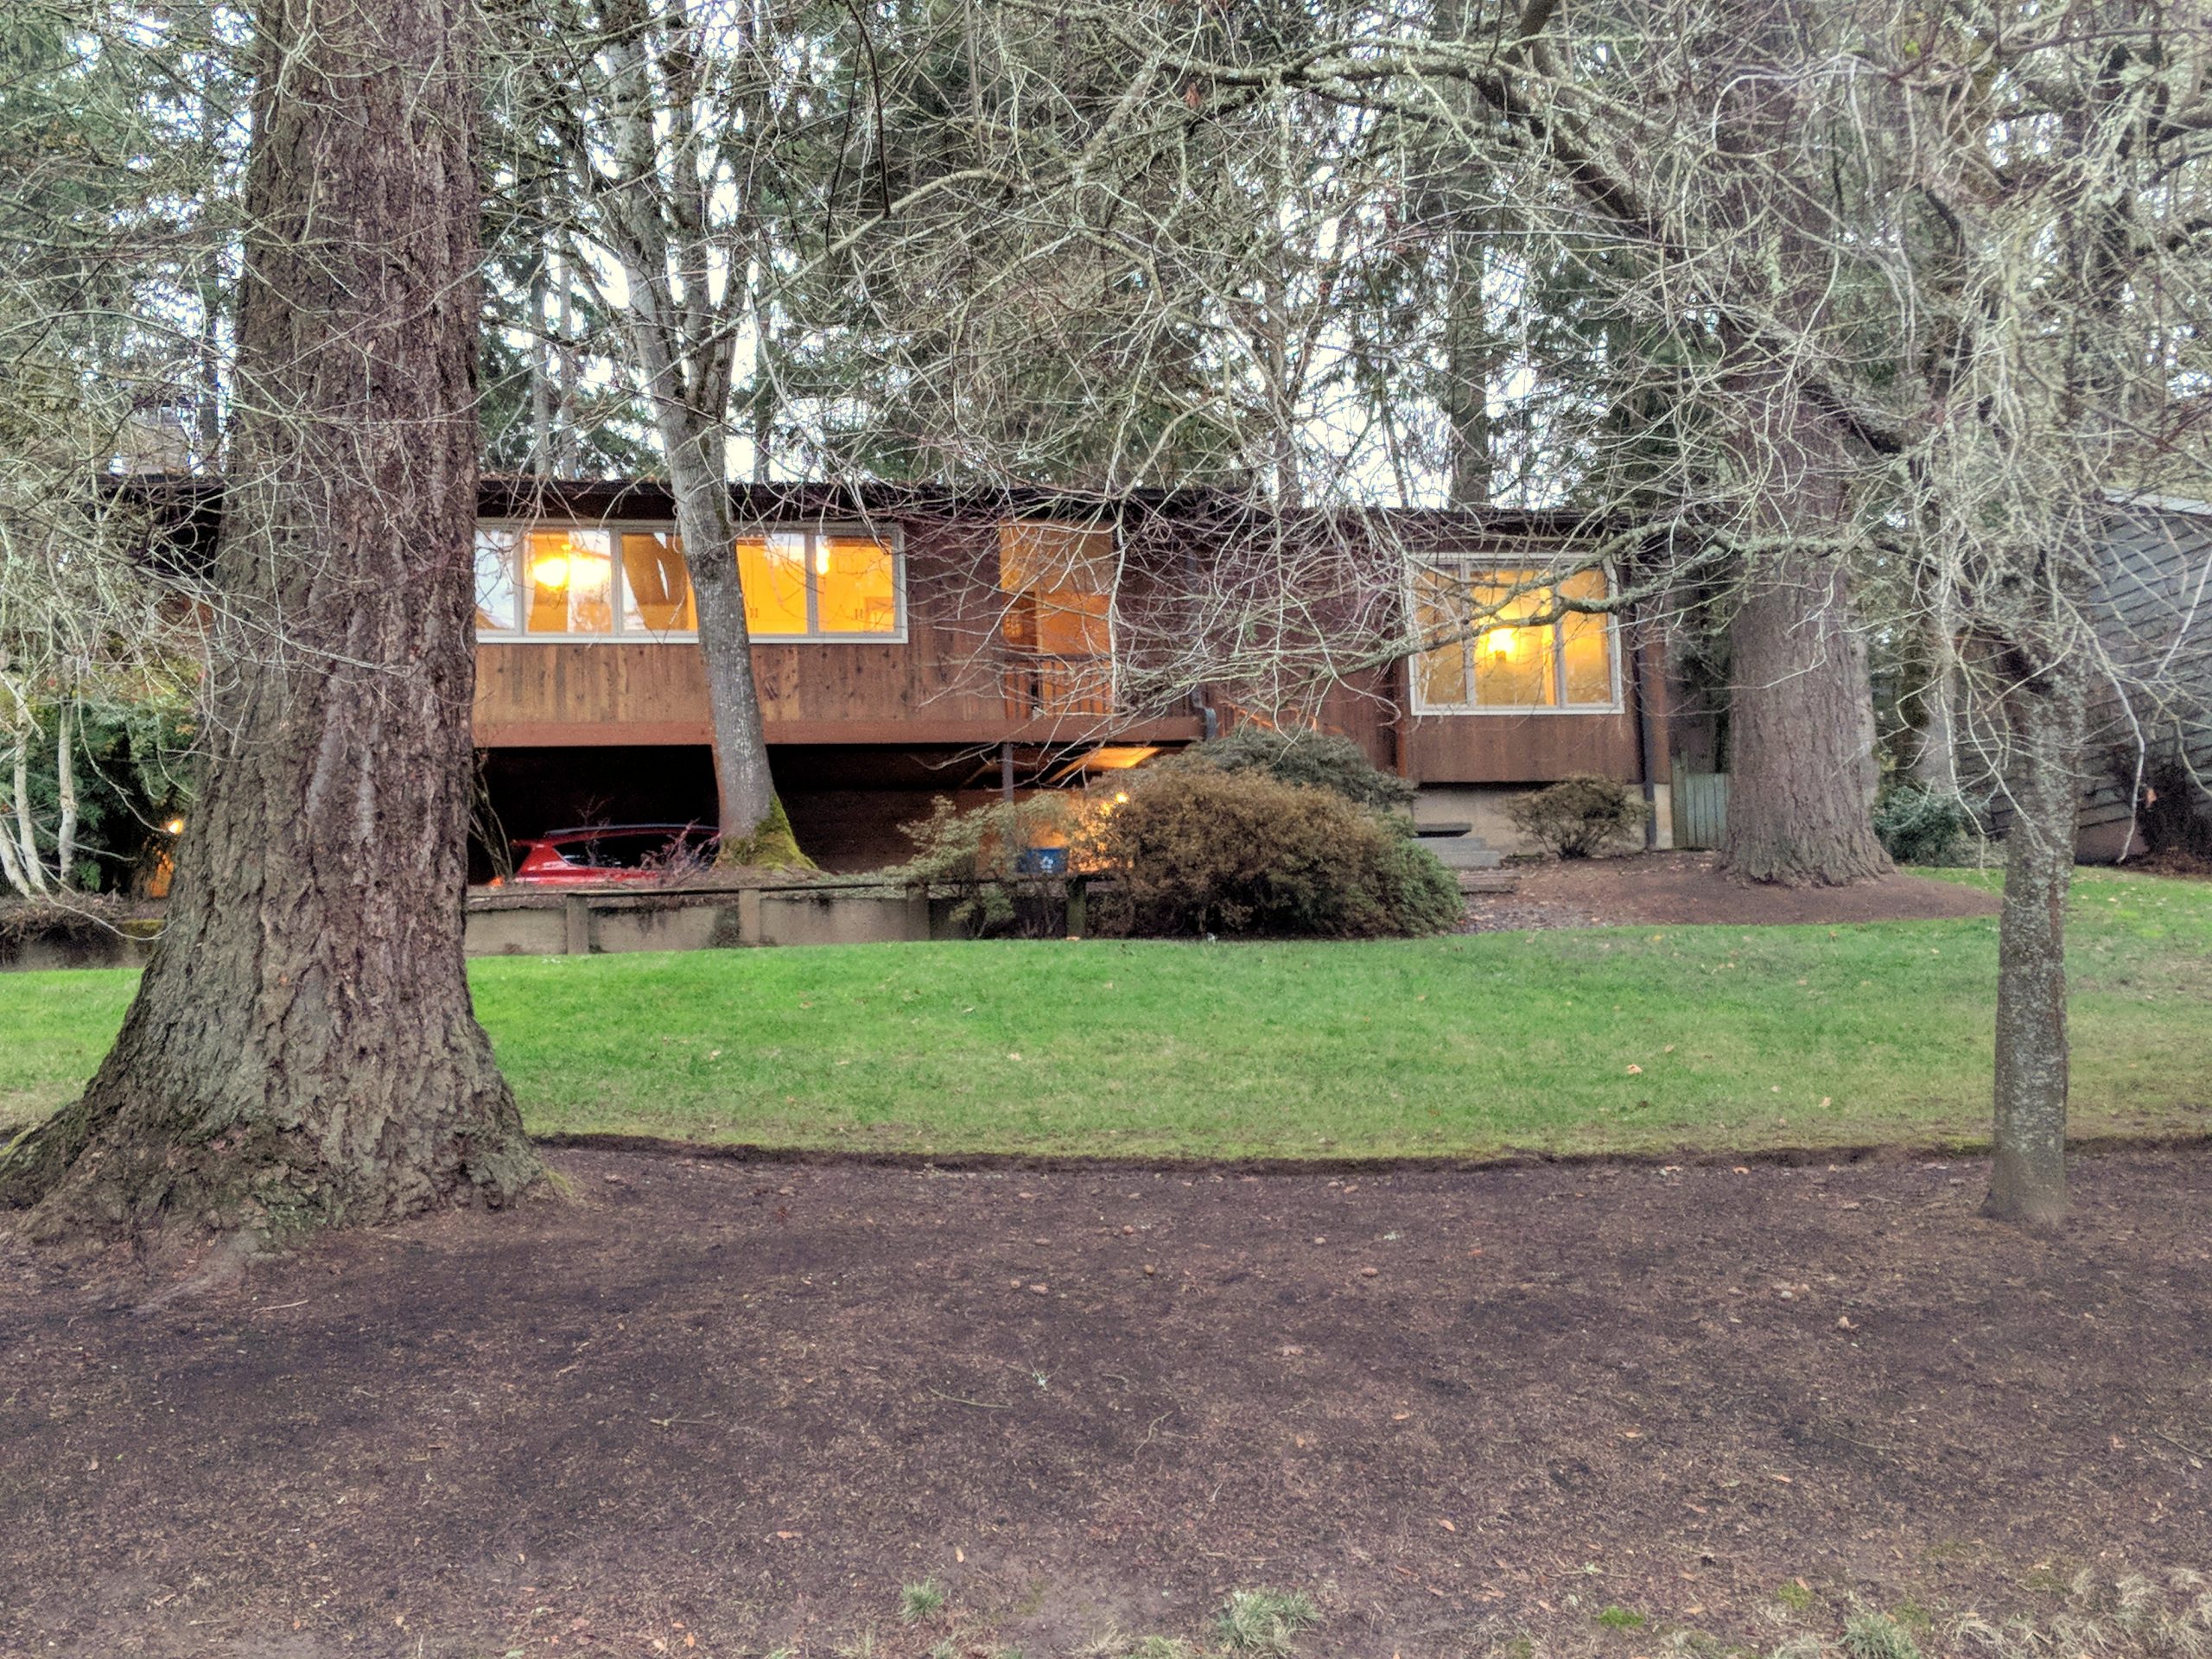
Linda Rossi – November 21, 2018
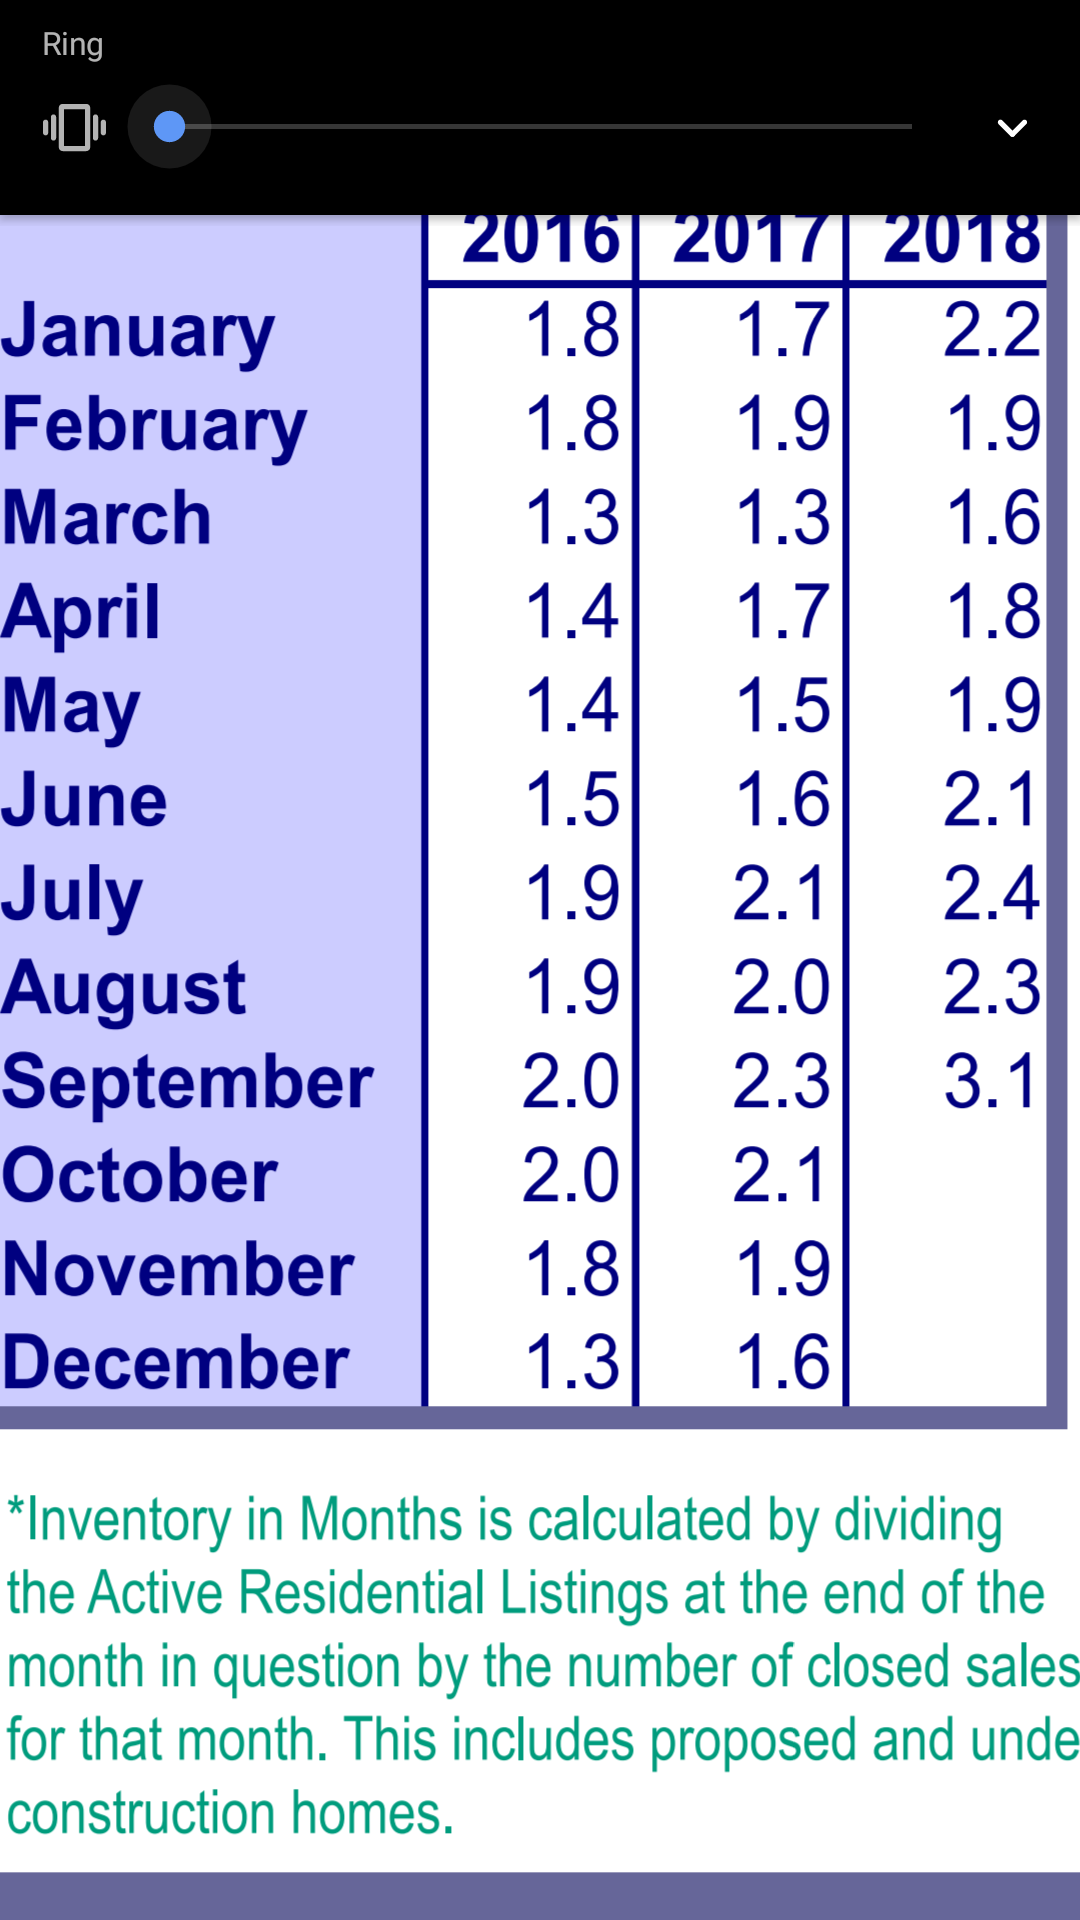
Inventory is still higher than usual, but is coming down just a bit. I hate to keep beating this drum, but it really is the best time of year to buy. Two of my clients In particular just snapped up two gorgeous homes and had great options from which to choose. At this time of year prices have cooled and there aren’t quite as many Buyers out fighting you for showings. Its a perfect combination of variables.
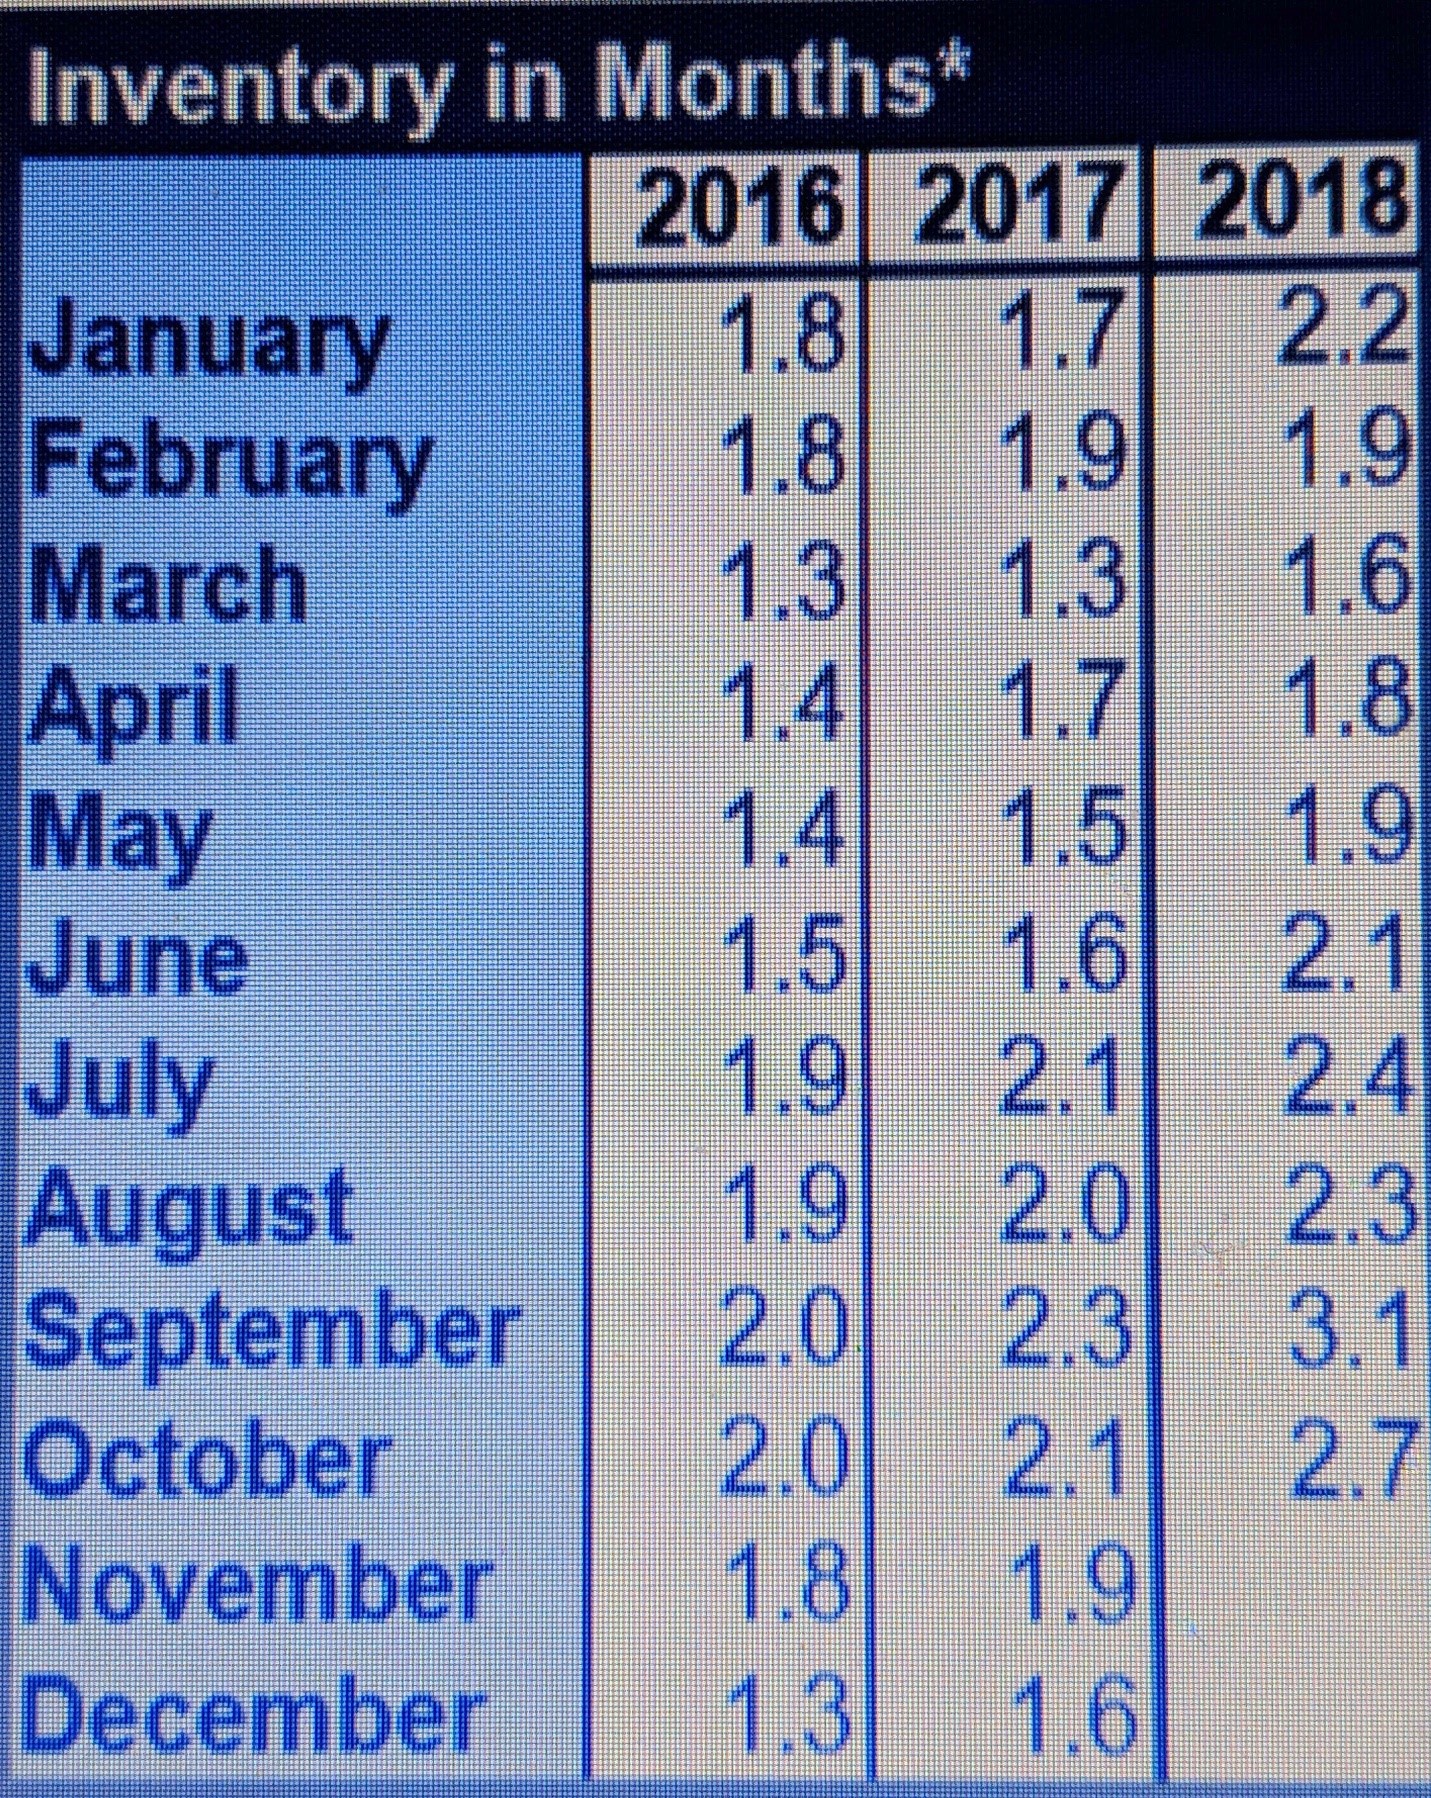
Here is your look at the most recent data for the entire Portland area (October):
According to the RMLS Market Action Report for the Portland Metro Area, October, 2018:
Neighborhoods: October’s Average Sale Price + 12-month Appreciation:
Linda Rossi – November 15, 2018
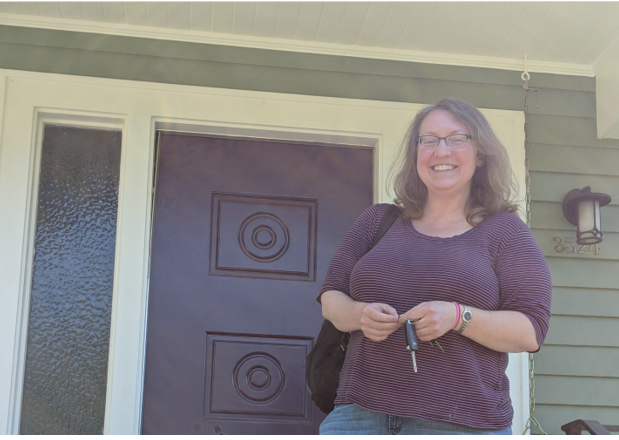
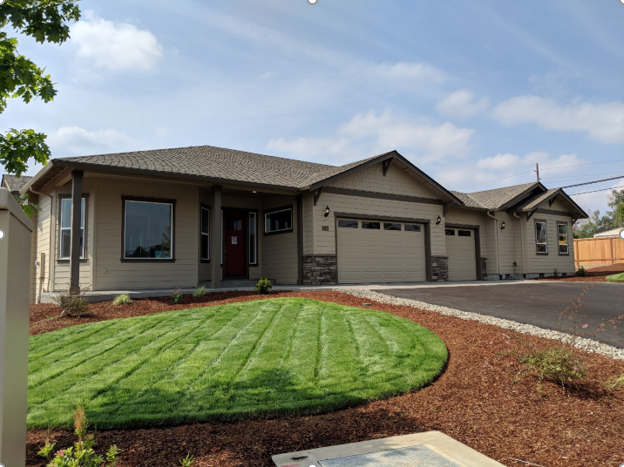
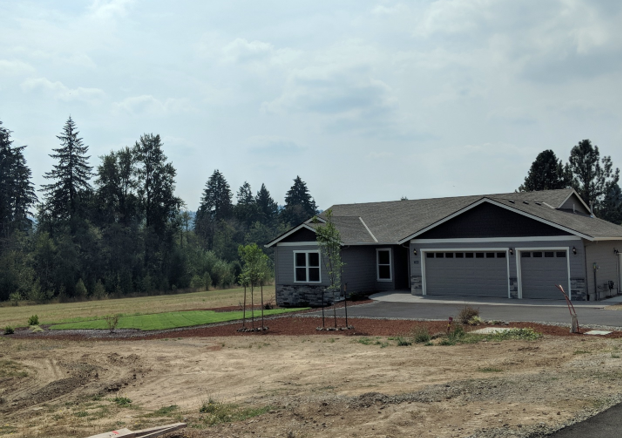
I Love it when I remember to take a picture~
Linda Rossi – September 19, 2018
Activity continues to be mixed in the Portland area. A lot of it is seasonal/happens every year. Some looks like a slight cooling trend.
Here is your look at the most recent data for the entire Portland area (August) and broken down by neighborhood below:
According to the RMLS Market Action Report for the Portland Metro Area, August, 2018:
• There were 4,214 New Listings in August 2018 which was up 4.1% from August of 2017’s 4,048, and down 2.3% from the previous month/July of 2018’s total of 4,312 .
• At 2,967, August Closed Sales fell 2.2% from August 2017’s 3,034, and/but were up 8.4 % from the previous month/July 2018’s total of 2,736.
• August’s Pending Sales (accepted offers), at 2,760 were cooler at 10.2% down from August of 2017’s 3,072, and 10.1% down as well from the previous month/July 2018’s total of 3,071.
• The Average Sale Price in August of $462,400 was up $26,700 from August 2017’s $436,400, and also up from the previous month/July 2018’s $455,100 by $7,300.
Neighborhoods: August’s Average Sale Price + 12-month Appreciation :
• North Portland: $403,000 4.6% (July 415,900)
• NE Portland: $468,800 4.1% (July 467,400)
• SE Portland: $427,500 7.3% (July 425,400)
• Gresham/Troutdale: $360,000 10.5% (July 361,500)
• Milwaukie/Clackamas: $444,000 5.2% (July 427,400)
• Oregon City/Canby: $436,000 7.7% (July 439,400)
• Lake Oswego/West Linn:$745,100 5.1% (July 689,700)
• West Portland: $646,200 3.6% (July 591,000)
• NW Wash County: $557,900 4.4% (July 552,500)
• Beaverton/Aloha: $406,600 8.0% (July 383,600)
• Tigard/Wilsonville: $466,100 8.1% (July 452,700)
• Hillsboro/Forest Grove: $386,900 7.5% (July 403,100)
Linda Rossi – August 22, 2018
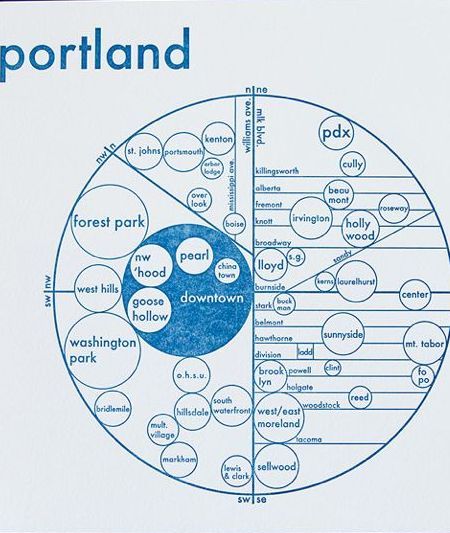
Explore Some Portland Neighborhoods…With Me!
There are a bunch of favorites of mine I would have included (in the Portland Monthly piece below) with nearby shops & “feel”… St Johns isn’t on here (?!)…Hollywood & Beaumont… Irvington & Sabin… Sellwood… Montavilla (though I guess that’s in their “82nd”?) & Tabor… little town of Milwaukie… Alberta & Dekum… Johns Landing up towards Corbett… South Burlingame & Carson Heights… Multnomah Village…and lots more. Call me!
Here’s the Portland Monthly Piece on 6 Neighborhoods: CLICK HERE

Linda Rossi – August 15, 2018
Activity overall is mixed in the Portland area in relation to 2017, and the general consensus is that the market is leveling out a bit. Here is your look at the most recent data for the entire Portland area (July) and broken out by neighborhoods just below:
According to the RMLS Market Action Report for the Portland Metro Area, July, 2018:
Neighborhoods: July’s Average Sale Price + 12-month Appreciation :
Linda Rossi – July 28, 2018
I Love my job!!!