mmm
Overview/Fluctuations ~ Market Data February 2022:
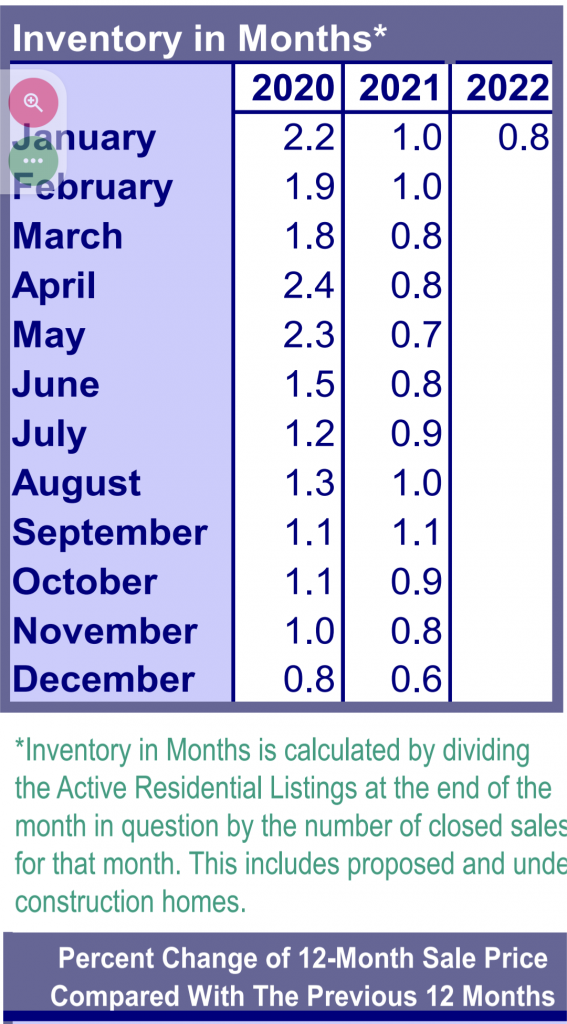
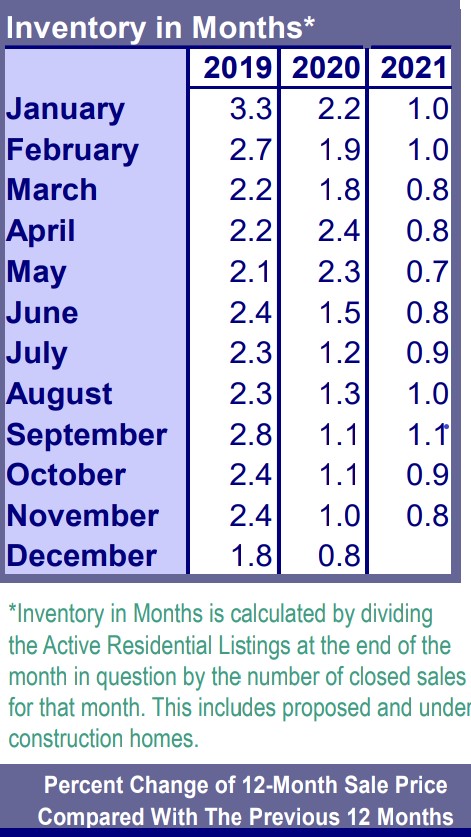
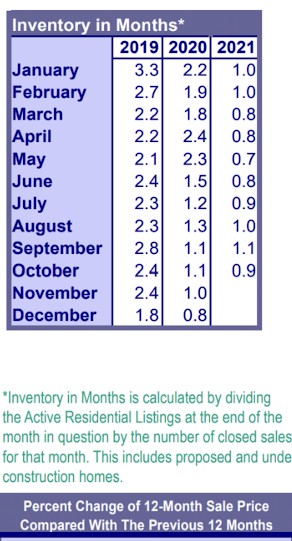
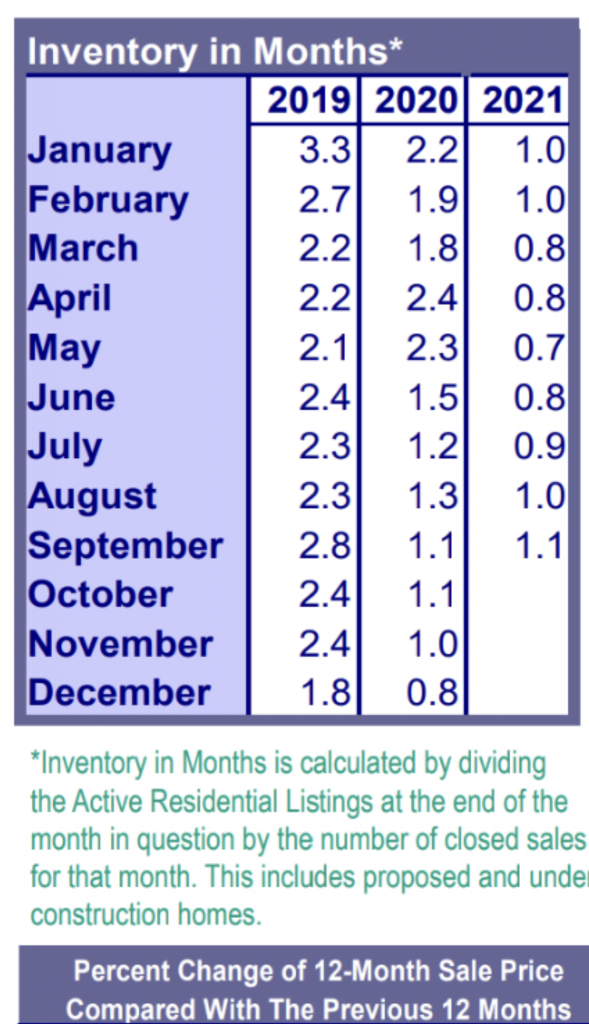
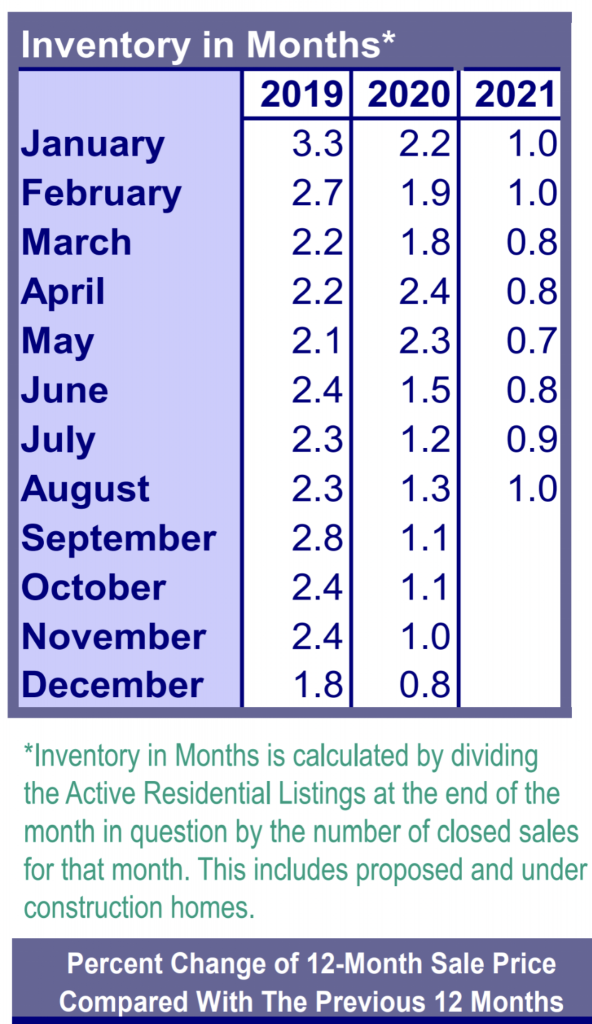
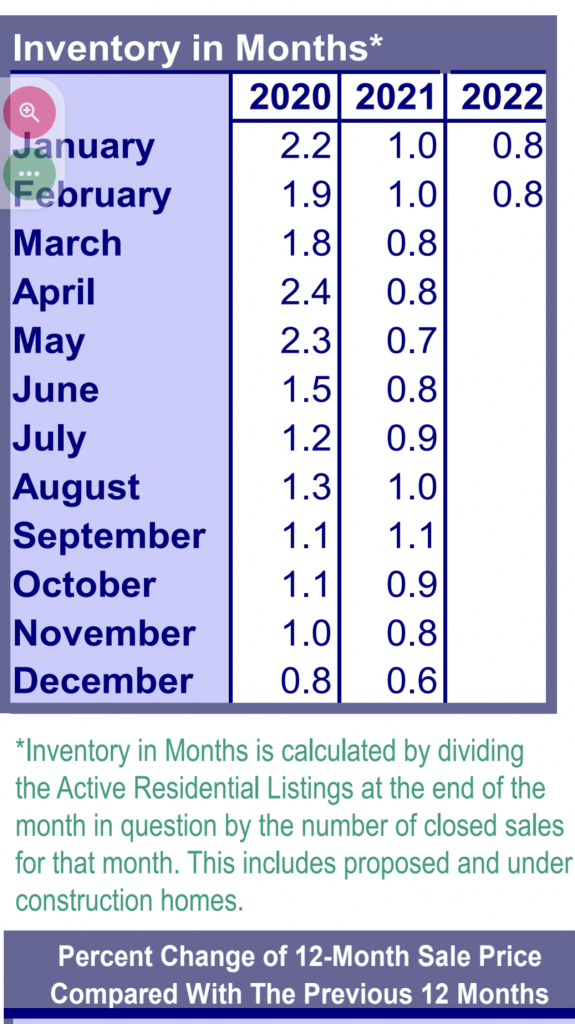
In the first two months of 2022 as compared to the same period in 2021, New Listings have decreased 3.6%, Pending Sales have slightly increased at 0.6% and Closed Sales decreased 1.0%. Supply is still the drama queen affecting the local market and remains at historic lows, meaning Buyers are in heavy competition over what’s available. The other factor is rates. They are going to be going up, and not likely coming back down as low as they’ve been anytime soon, so if you’re wanting to purchase a home, it would be a good idea not to put it off.
Rates: “We have seen extreme volatility in the markets over the last few weeks. Right now 30-year fixed rates stand at about 4.125%.”Gary Boyer, Regional VP, Directors Mortgage
According to the RMLS Market Action Report for the Portland Metro Area- Feb 2022:
- There were 2,571 New Listings in Feb 2022 increased 3.9% from Feb of 2021’s 2,474, and increased 11.4% from the previous month/Jan’s 2,307.
- At 1,939 Feb 2022’s Closed Sales are down 2.0% from Feb 2021’s 1,978, and up 4.6% from the previous month/Jan 2022’s total of 1,853
- At 2,452 Feb 2022’s Pending Sales are up 11.1% from Feb 2021’s 2,208, and up 7.2% from the previous month/Jan 2022’s total of 2,287.
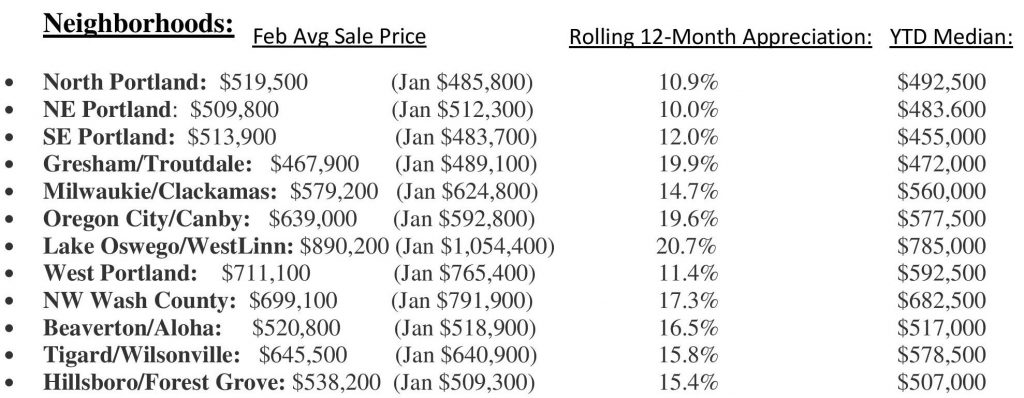
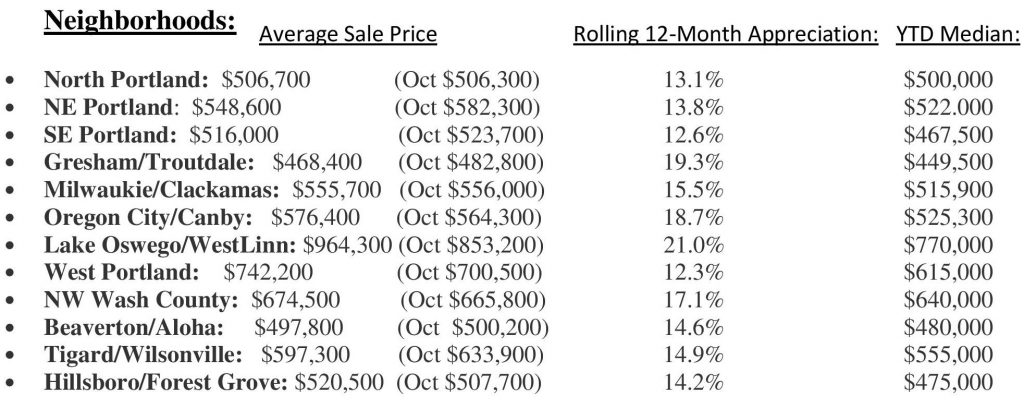
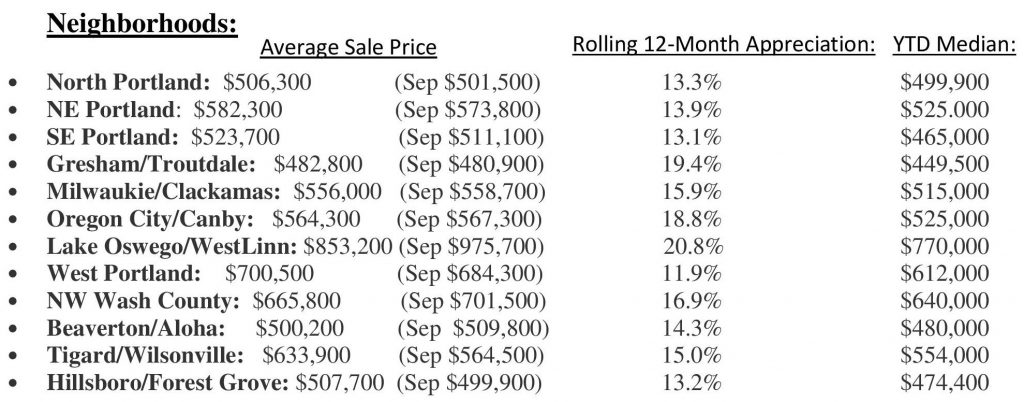
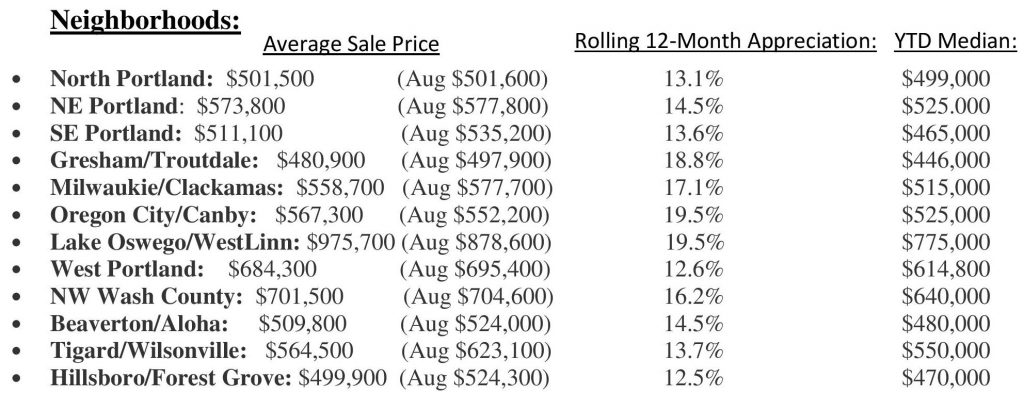
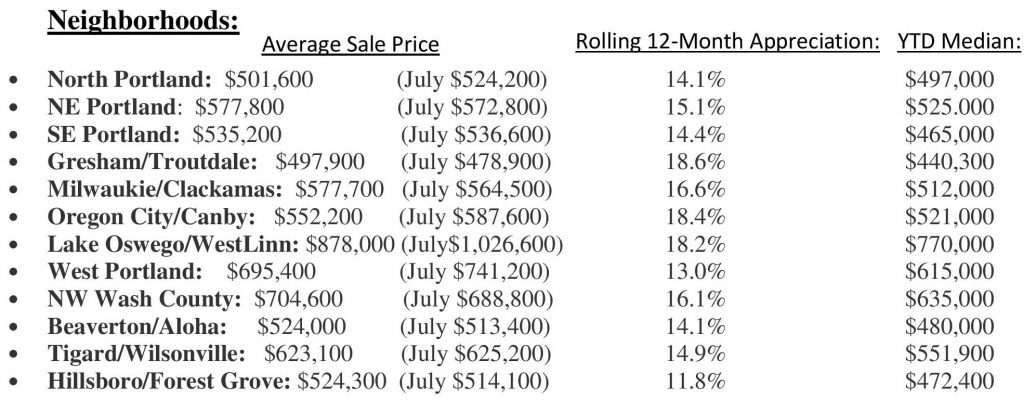
- The Average Sale Price in Feb 2022 of $582,200 is up $40,200 from last year/Feb 2021’s $542,000, and down a bit at $4,400 from the previous month/Jan’s $586,600.
- The “Median” Sale Price (the price smack dab in the middle of all sales) in Feb 2022 of $525,000 rose from last year/Feb 2021’s $479,100 by $45,900, and $13,000 from the previous month/Jan’s $512,000.