Linda Rossi – October 16, 2019


Getting You Where You Want To Go
Linda Rossi – October 16, 2019
Linda Rossi – September 17, 2019
Linda Rossi – August 19, 2019
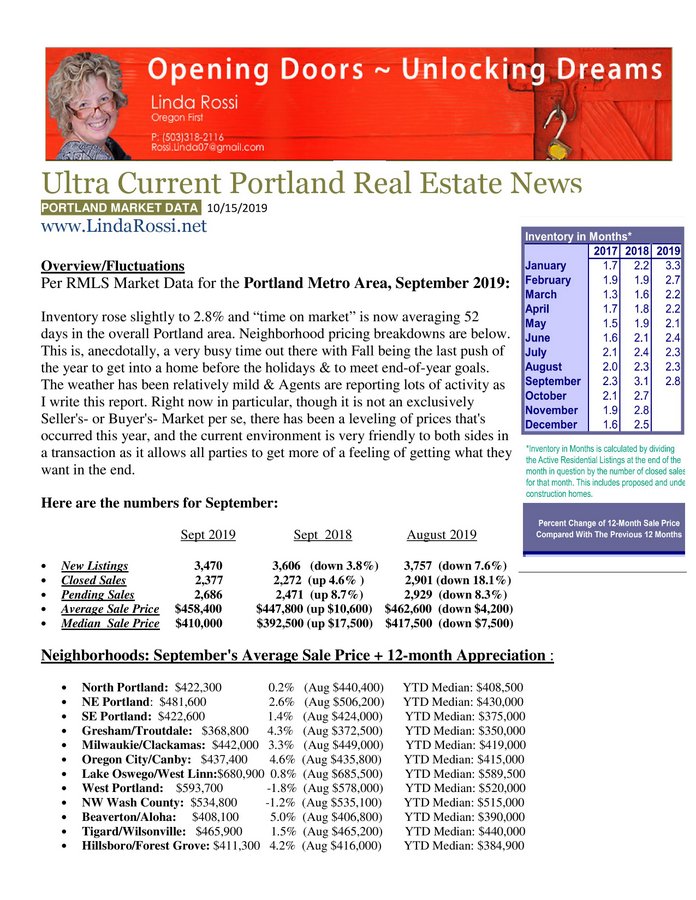
Overview/Fluctuations
Overall we see prices leveling out everywhere. N Portland and NW Washington County are two areas where we see slight depreciation, but this is not as scary as it looks; more an indicator that prices jumped a bit beyond what Buyers were willing to pay in these areas and there is now a correction in process. Gresham, Oregon City and Beaverton/Aloha in particular remain very strong (see below), and the whole Portland area is pretty solid, albeit w/prices cooling a bit & some seasonal slowing.
Though most think Summertime is the busy season for real estate, truth is that it slows down dramatically as people are off on vacation etc. Spring is the hottest time for Sellers, and the current market and Fall are my favorite times to represent Buyers as they find a new home to call their own. : ) AND, if a home is priced and marketed properly, I have continuing and long-standing success Selling in any time of year.
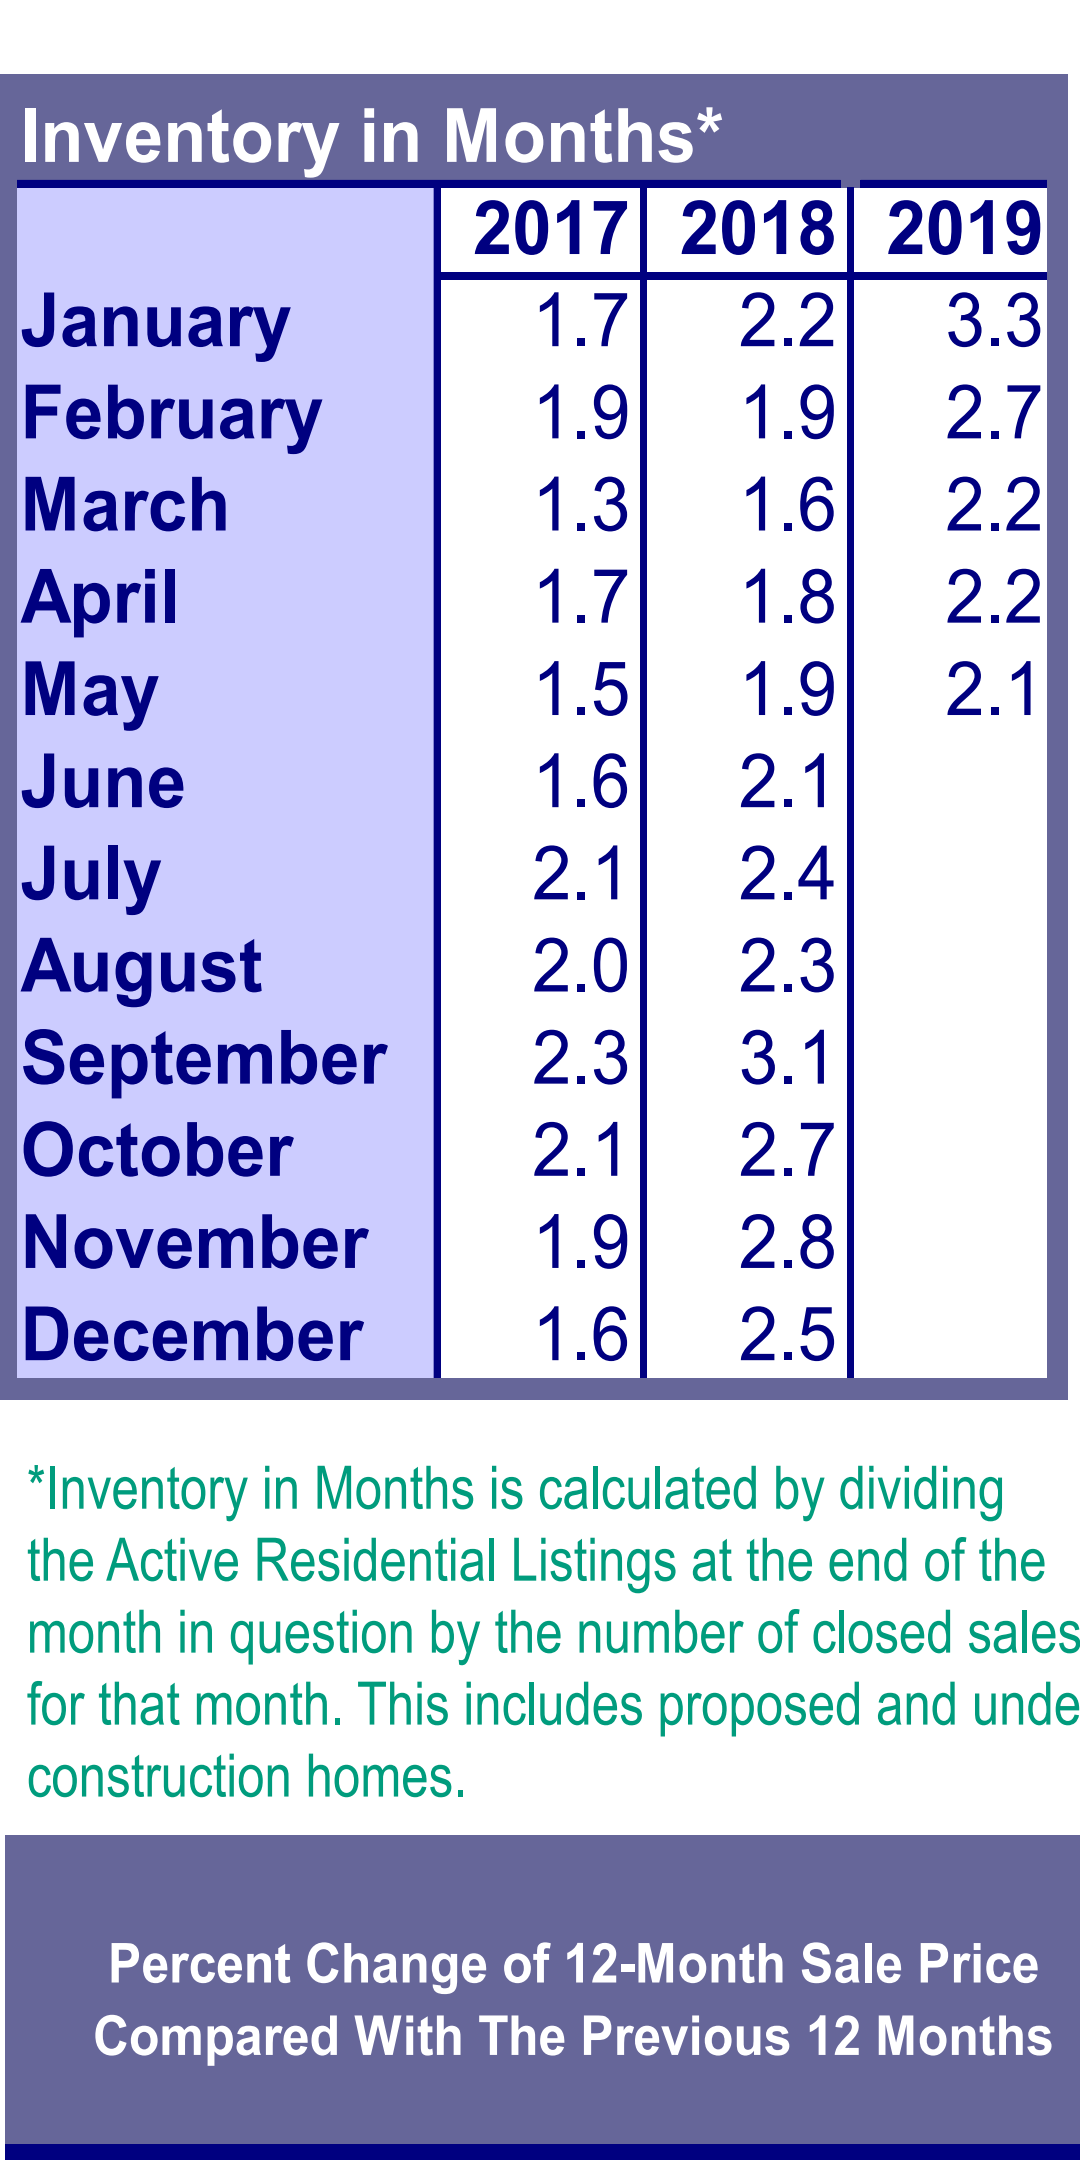
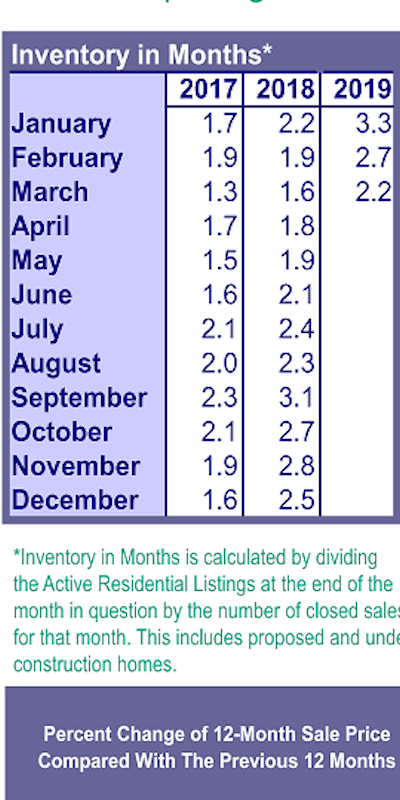
Per RMLS Market Data for the Portland Metro Area, July 2019:
July 2019 July 2018 June 2019
Neighborhoods: July’s Average Sale Price + 12-month Appreciation :

Linda Rossi – August 6, 2019
Another One Sold!
Linda Rossi – July 16, 2019
Overview/Fluctuations:
Per RMLS Market Data for the Portland Metro Area, June 2019:
Neighborhoods:
May’s Average Sale Price + 12-month Appreciation (and Year-to-Date Median Sale Price):
Linda Rossi – June 15, 2019
Overview/Fluctuations
Per RMLS Market Data for the Portland Metro Area, May 2019:
Neighborhoods:
May’s Average Sale Price + 12-month Appreciation (and Year-to-Date Median Sale Price):
Linda Rossi – April 12, 2019

4 Bd/3 Ba, 2014 Craftsman ***Close-in St Johns*** 1953 Finished SF ~ Hardwood Plank Floors Throughout ~ Granite/Stainless Kitchen ~ Jetted Soaking Tub ~ Smart Remote Switches ~ Laundry Upstairs/Washer Dryer Included ~ Porch & Covered Back Deck ~ Fenced Backyard ~ High Efficiency Everything ~ Lg Lower Level Bedroom, Media Room, or… $479,000
Linda Rossi – April 12, 2019
Overview/Fluctuations Per RMLS Market Data for the Portland Metro Area, March 2019:
Neighborhoods:
March’s Average Sale Price + 12-month Appreciation (and Year-to-Date Median):